This version is free to view and download for private research and study only. Not for re-distribution or re-use. © John H. Williamson
Abstract
Bayesian modelling has much to offer those working in human-computer interaction but many of the concepts are alien. This chapter introduces Bayesian modelling in interaction design. The chapter outlines the philosophical stance that sets Bayesian approaches apart, as well as a light introduction to the nomenclature and computational and mathematical machinery. We discuss specific models of relevance to interaction, including probabilistic filtering, non-parametric Bayesian inference, approximate Bayesian computation and belief networks. We include a worked example of a Fitts' law modelling task from a Bayesian perspective, applying Bayesian linear regression via a probabilistic program. We identify five distinct facets of Bayesian interaction: probabilistic interaction in the control loop; Bayesian optimisation at design time; analysis of empirical results with Bayesian statistics; visualisation and interaction with Bayesian models; and Bayesian cognitive modelling of users. We conclude with a discussion of the pros and cons of Bayesian approaches, the ethical implications therein, and suggestions for further reading.
Introduction
We assume that most readers will be coming to this text from an interaction design background and are looking to expand their knowledge of Bayesian approaches, and this is the framing we have started from when structuring this chapter. Some readers may be coming the other way, from a Bayesian statistics background to interaction design. These readers will find interesting problems and applications of statistical methods in interaction design.
This book discusses how Bayesian approaches can be used to build models of human interactions with machines. Modelling is the cornerstone of good science, and actionable computational models of interactive systems are the basis of computational interaction [oulasvirta_computational_2018]. A Bayesian approach makes uncertainty a first-class element of a model and provides the technical means to reason about uncertain beliefs computationally.
Human-computer interaction is rife with uncertainty. Explicitly modelling uncertainty is a bountiful path to better models and ultimately better interactive systems. The Bayesian world view gives an elegant and compelling basis to reason about the problems we face in interaction, and it comes with a superbly equipped wardrobe of computational tools to apply the theory. Bayesian approaches can be engaged across the whole spectrum of interaction, from the most fine-grained, pixel-level modelling of a pointer to questions about the social impact of always-on augmented reality. Everyone involved in interaction design, at every level, can benefit from these ideas. Thinking about interaction in Bayesian terms can be a refreshing perspective to re-examine old problems.
And, as this book illustrates, it can also be transformational in practically delivering the human-computer interactions of the future.
This chapter is intended to be a high-level look at Bayesian approaches from the point of view of an interaction designer. Where possible, I have omitted mathematical terminology; the Appendix of the book gives a short introduction to standard terminology and notation. In some places I have provided skeleton code in Python. This is not intended to be executable, but to be readable way to formalise the concepts for a computer scientist audience, and should be interpretable even if you are not familiar with Python. All data and examples are synthetic.
The chapter is structured as follows:
- An short introduction to Bayesian inference for the unfamiliar.
- A high-level discussion of the distinctive aspects of Bayesian modelling.
- A detailed worked example of Bayesian modelling in an HCI problem.
- A short summary of Bayesian algorithms and techniques particularly relevant to interaction, including approximate Bayesian computation, Bayesian optimisation and probabilistic filtering.
- A discussion of the important facets of Bayesian interaction design.
- Finally, a reflection on the implications of these ideas, and recommendations for further reading.
What are Bayesian methods?
Bayesian methods is a broad term. In this book, the ideas are linked by the fundamental property of representing uncertain belief using probability distributions, and updating those beliefs with evidence. The underpinning of probability theory puts this on a firm theoretical basis, but the concept is simple: we represent what we know about the specific aspects of the world with a distribution that tells us how likely possible configurations of the world are, and then refine belief about these possibilities with data. We can repeat this process as required, accumulating evidence and reducing our uncertainty.
In its simplest form, this boils down to simply counting potential configurations of the world, then adjusting those counts to be compatible with some observed data. This idea has been become vastly more practical as computational power has surged, making the efficient “counting of possibilities” a feasible task for complex problems.
Why model at all?
For the 21st century, replace “mechanical” with “computational”.
Modelling creates a simplified version of a problem that we can more easily manipulate, and could be mathematical, computational or physical in nature. Good science depends on good models. Models can be shared, criticised and re-used. Fields of study where there is healthy exchange of models can “ratchet” constructively, one investigation feeding into the next. In interaction design, modelling has been relatively weak. When models have been used, they have often been descriptive in nature rather than causal. One of the motivations for a Bayesian approach is in the adoption of statistical models that are less about describing or predicting the superficial future state of the world and more about predicting the underlying state of the world. The other motivation is to build and work with models that properly account for uncertainty.
We can consider the relative virtues of models, in terms of their authenticity to the real-world phenomena, their complexity, or their mathematical convenience. However, for the purposes of human-computer interaction, there are several virtues that are especially relevant:
- Models that are generative and can executed in a computer simulation to produce synthetic data.
- Models that are computational and can be manipulated, transformed and validated algorithmically; for example written as programs.
- Models that are conveniently parameterisable and ideally have parameters that are meaningful and interpretable.
- Models that are causal and describe the underlying origins of phenomena rather than predict the manifestations of phenomena.
- Models that preserve and propagate uncertainty.
- Models that fit well with software engineering practices to deploy them, whether embedded in an interaction loop, in design tools or in analyses of evaluations.
What is distinctive about Bayesian modelling?
Bayesian modelling has several salient consequences:
- We can often directly use simulators of the process we believe to be generating the world that we observe, instead of relying on abstract, fixed models that can be difficult to shoehorn into interaction problems. For example, we might be able to use a detailed, agent based simulation of pedestrian movement, rather than a standard regression model.
- We reason from belief to evidence, not the other way around. This subtle difference means that we have a way to easily fuse information from many sources. This can range from sensor fusion in an inertial measuring unit to meta-reviews of surveys in the literature.
- We have a universal approach to solving problems, that gives us a simple and consistent way to formulate questions and reason our way to answers.
- We also have a universal language with which to exchange and combine information: the probability distribution. Want to plug a language model into a gesture recogniser? No problem; exchange probability distributions.
- That same freedom and flexibility to model, and the need to represent distributions rather than values, implies technical difficulties. The devil is in the details.
How is this relevant to interaction design?
Everything we do in interaction and design of interactive systems has substantial uncertainty inherent in it.
We don't know who our users are. We don't know what they want, or how they behave, or even how they tend to move. We don't know where they are, or in what context they are operating. The evidence that we can acquire is typically weakly informative and often indirectly related to the problems we wish to address. This extends across all levels of interaction, from tightly closed control loops to design-time questions or retrospective evaluations. For example:
- Is a user's pointing movements indicating an intention to press button A or button B?
- Is now a good moment to pop-up a dialog?
- How many touch interaction events will happen in the next 500ms?
- How tired is the user right now?
- Is it better to allocate a shorter keyboard shortcut to
Saveor forRefresh? - Does adding spring-back to a scrolling menu increase or decrease user stress?
- Which volatility visualisation strategy helps users make more rational decisions?
- Is this interactive system more or less likely to polarise society?
We typically have at least partial models of how the human world works: from psychology, physiology, sociology or physics. Good interaction design behooves us to take advantage of all the modelling we can derive from the research of others. Being able to slot together models from disparate fields is essential to advance science. The Bayesian approach of formally incorporating knowledge as priors can make this a consistent and reasonable thing to do.
We are in the business of interacting with computers — so computational methods are universally available to us. We care little about methods that are efficient to be hand-solved algebraically. The blossoming field of computational Bayesian statistics means that we can realistically embed Bayesian models in interactive systems or use them to design and analyse empirical studies at the push of the button. We have problems where it is important to pool and fuse information, whether in low-level fusion of sensor streams or combining survey data from multiple studies. We have fast CPUs and GPUs and software libraries that subsume the fiddly details of inference.
What does this give us?
Why might we consider Bayesian approaches?
- Taming uncertainty by representing and manipulating it grants us robustness; whether this is robustness within a control loop or in the interpretation of the evaluation of a system. Represented uncertainty regularises predictions and avoids making extreme inferences based on limited data.
- We explicitly and precisely model prior beliefs. This allows knowledge to be encoded, inspected and shared, whether among software components or among researchers.
- A focus on generative models leads us to model constructively; to build models that synthesize what we expect to observe. These models can be strikingly more insightful than models that seek to summarise or describe what we have observed.
- Bayesian inference makes it realistic to fuse information from many sources without ad hoc tricks, and a principled way to deal with missing data and imputation.
Most of all, it gives us a new perspective from which to garner insight into problems of interaction, supported by a bedrock of mathematical and computational tools.
Is this just for statistical analysis?
Bayesian methods are a powerful tool for empirical analysis, and historically Bayesian methods have been used for statistical analyses of the type familiar to HCI researchers in user evaluations. But that is not their only role in interaction design, and arguably not even the most important role they can play. Bayesian methods can be used directly within the control loop as a way of robustly tracking states (for example, using probabilistic filtering). Bayesian optimisation makes it possible to optimise systems that are hard and expensive to measure, such as subjective responses to UI layouts. Bayesian ideas can change the way we think about how users make sense of interfaces, how we should represent uncertainty to them and how we should predict users' cognitive processes.
A short tutorial
- model a simplified representation of a problem that has some parts that can vary. Our models will always be implemented as computer programs.
- parameter one variable in a model that partially determines how a model operates.
- configuration a collection of parameter values that fully specifies a specific instantiation of a model.
- observations values which we observe, i.e. data.
- probability a number between 0 and 1 representing how much we believe something.
- distribution an assignment of probabilities to possible configurations, defining how likely each is.
- sample a specific value, drawn at random according to a probability distribution.
- prior a belief about the world before observing data, as a distribution over configurations.
- posterior a belief about the world after observing data, as a distribution over configurations.
- likelihood a belief about how likely observations are, given a configuration, as a distribution over possible observations.
- P(A) the probability that event A occurs.
- P(A, B) the probability that both event A and event B both together.
- P(A|B) the probability that event A occurs, if we know that B occurs.
An example of Bayesian inference
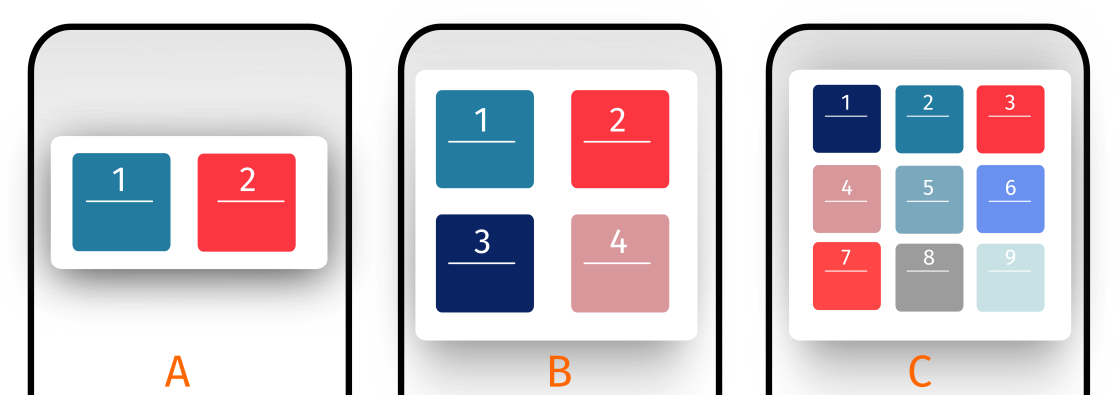
Imagine we have three app variants deployed to a group of users, A, B and C. App A has two buttons on the splash screen, App B has four, and App C has nine. We get a log event that indicates that “3" in the splash screen was pressed, but not which app generated it. Which app was the user using, given this information (Figure 2)?
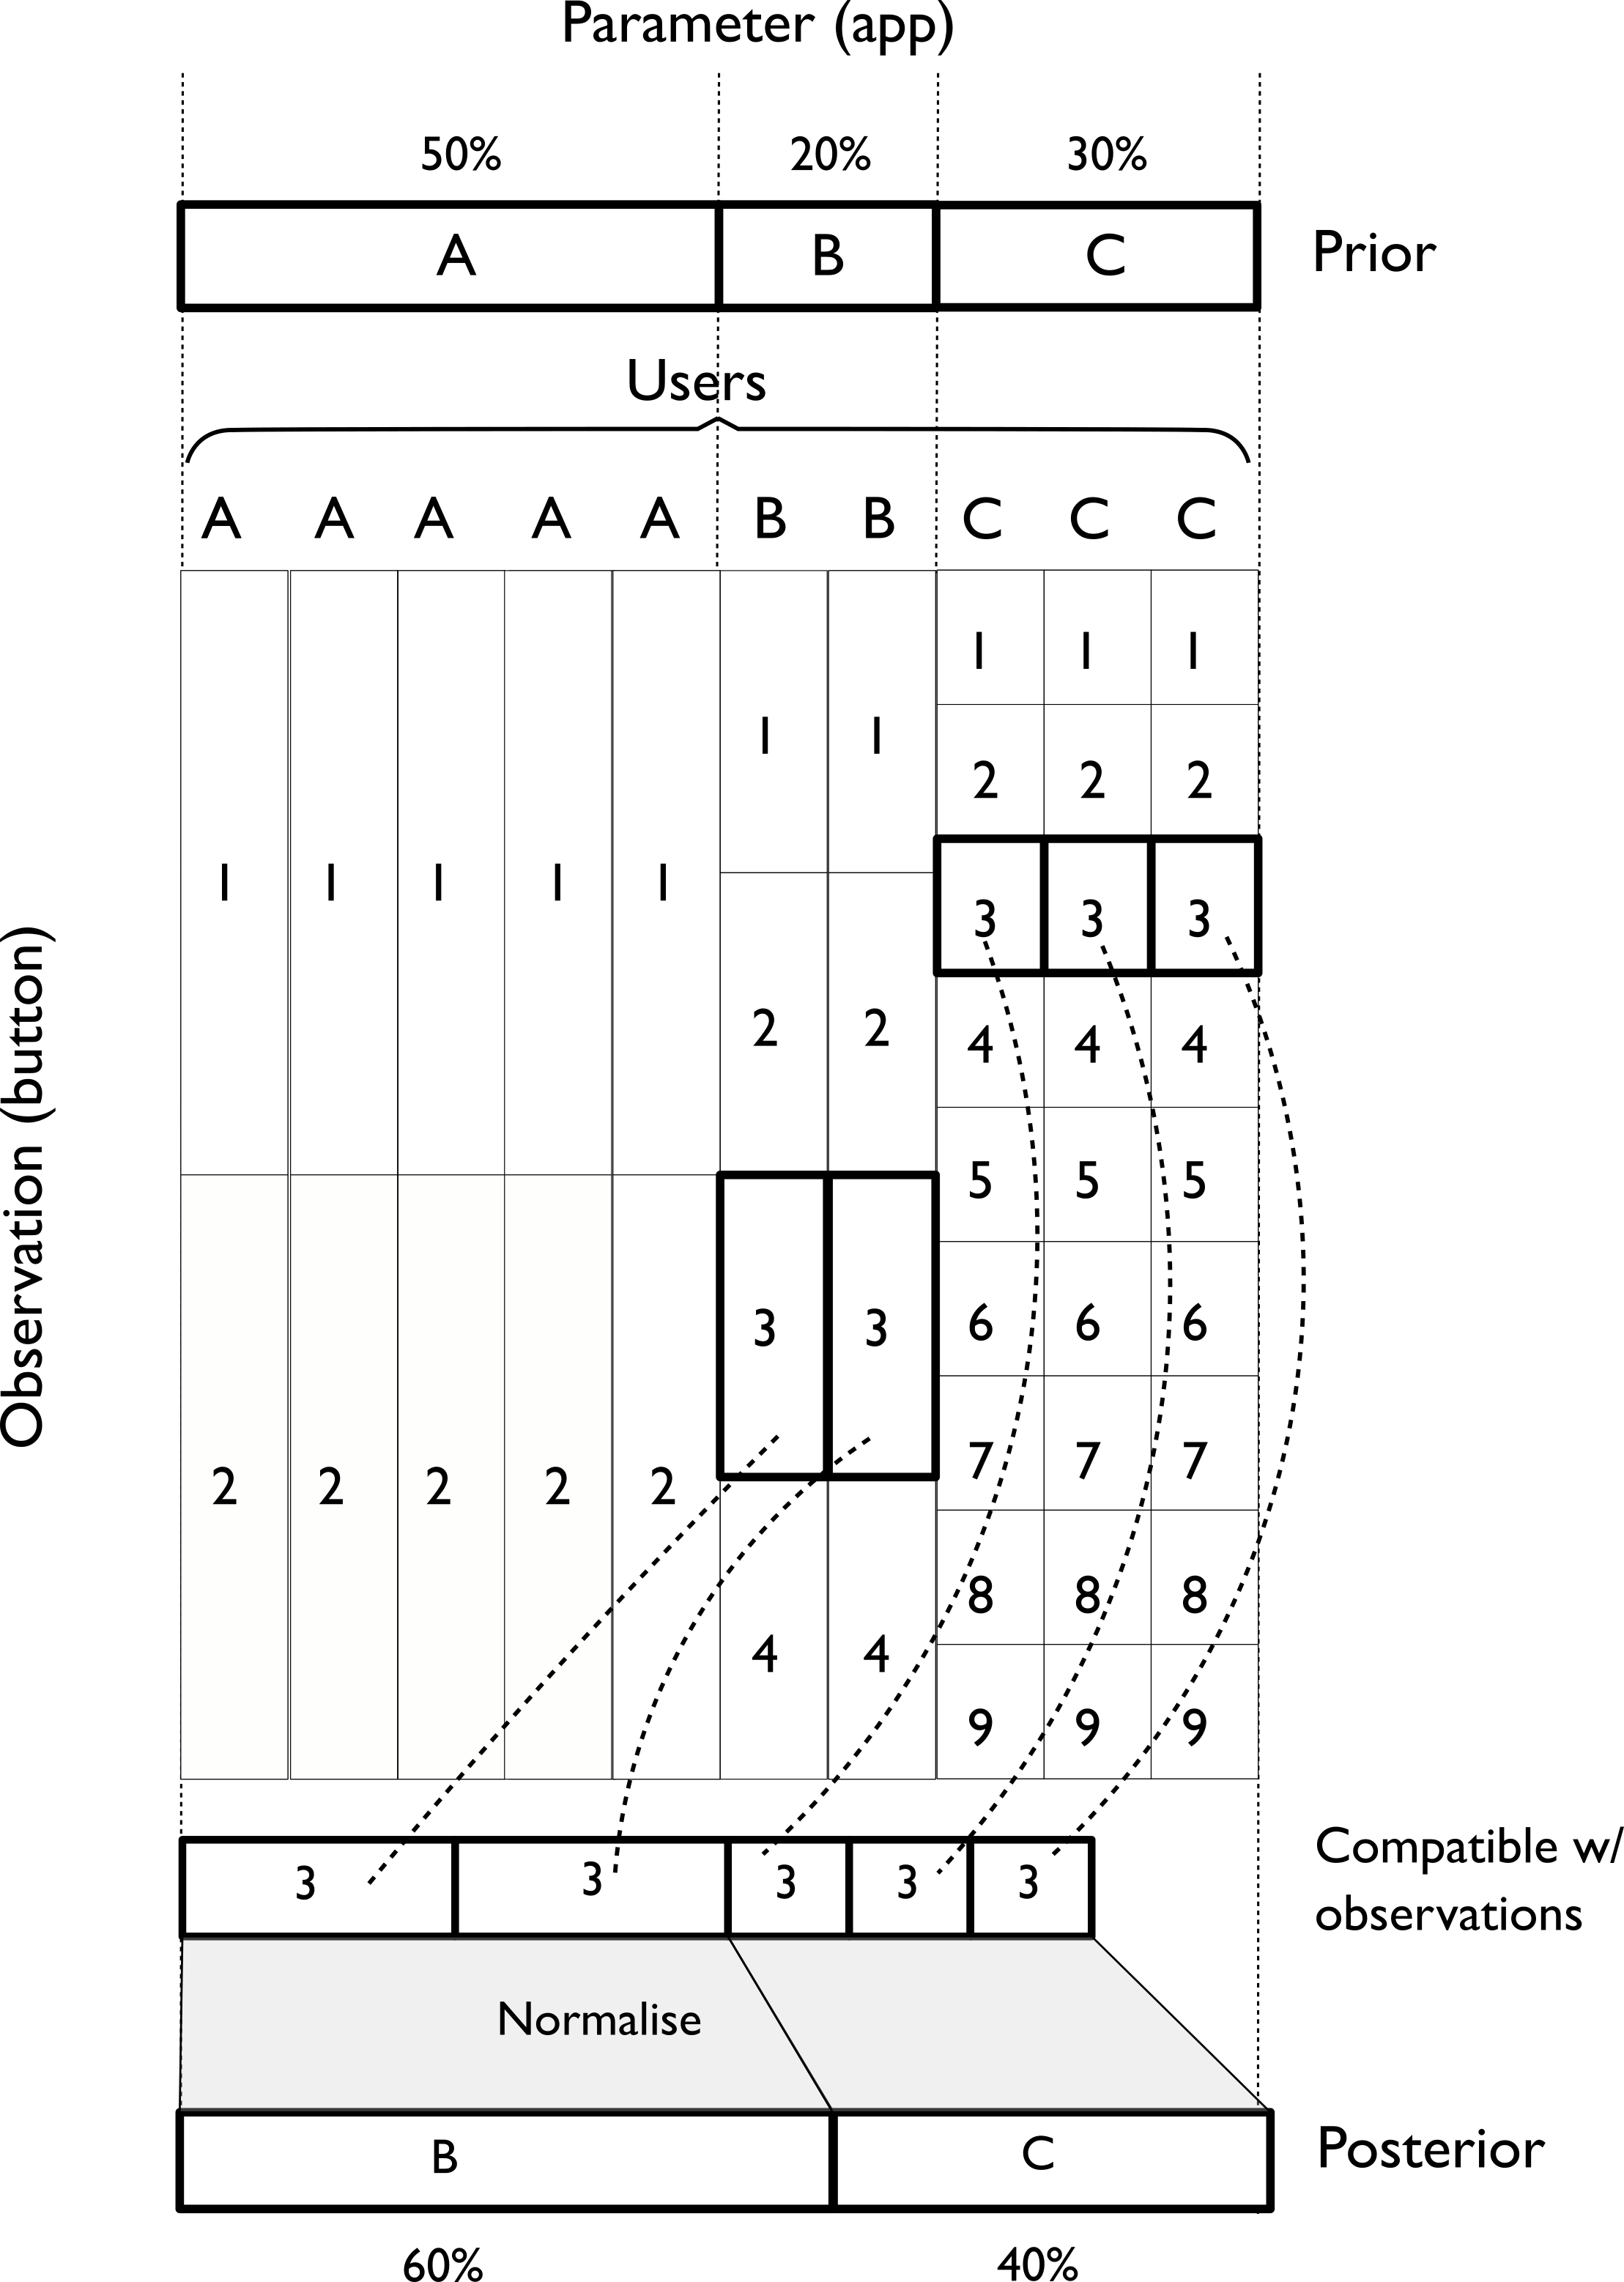
We have an unobserved parameter (which app is being used) and observed evidence (button 3 was pressed). Let us further assume there are 10 test users using the app: five using A, two using B and three using C. This gives us a prior belief about which app is being used (for example, if we knew nothing about the interaction, we expect it is 50% more likely that app C is being used than app B). We also need to assume a model of behaviour. We might assume a very simple model that users are equally likely to press any button — the likelihood of choosing any button is equal.
This is a problem of Bayesian updating (Figure 3); how to move from a prior probability distribution over apps to a posterior distribution over apps, having observed some evidence in the form of a button press.

How do we compute this? In this case, we can just count up the possibilities for each app, as shown in Figure 4.
We know that button 3 was logged, so:
- There is no possibility that the user was using App A, which has only two buttons.
- If they were using App B, 1/4 of the time they would press 3;
- and 1/9 of the time if using App C.
These numbers come directly from our assumption that buttons are pressed with equal likelihood, and so the likelihoods of seeing button 3 for each app are (A=0, B=1/4, C=1/9). Given our prior knowledge about the number of apps in use, we can multiply these likelihoods by how likely we thought the particular app was before observing the “3". This prior was (A=5/10, B=2/10, C=3/10). This gives us: (A=0 * 5/10, B=1/4 * 2/10, C=1/9 * 3/10) = (0, 1/20, 1/30). We can normalise this so it sums to 1 to make it a proper probability distribution: (0, 3/5, 2/5). This is the posterior distribution, the probability distribution revised to be compatible with the evidence. We now believe there is a 60% chance that app B was used and a 40% chance app C was used.
This is easy to verify if we simulate this model to generate synthetic data.
import random

def simulate_app():
    # simulate a random user with a random app
    app = random.choice("AAAAABBCCC")
    if app=='A':
            button = random.choice([1,2])
    if app=='B':
            button = random.choice([1,2,3,4])
    if app=='C':
            button = random.choice([1,2,3,4,5,6,7,8,9])
    return app, button
If we run this simulation, and highlight the events where button=3, we get output like in Figure 5.
Sorting the selected events and colouring them shows the clear pattern that B is favoured over C (Figure 6).
There are two key insights. First, the result of Bayesian inference is not always intuitively obvious, but if we can consider all possible configurations and count the compatible ones, we will correctly infer a probability distribution. Secondly, having a clear understanding of a model in terms of how it generates observations from unobserved parameters — to be able to simulate the model process — is a useful way to understand models and to verify their behaviour.
Another observation
A Bayesian update transforms a probability distribution (over apps, in this case) to another probability distribution. What happens if we see another observation? For example, we might next observe that the user next pressed the “2" button on the same app. How does this affect our belief? We use the posterior from the previous step (A=0, B=0.6, C=0.4) as the new prior, and repeat the exactly same process to get a new posterior. We can do this process over and over again, as new observations arrive.
- New prior (old posterior): (A=0, B=0.6, C=0.4)
- Observation: “2"
- Likelihood: (A=1/2, B=1/4, C=1/9)
- Unnormalised posterior: (A=1/2 * 0=0, B=1/4 * 0.6=0.15, C=1/9 * 0.4=0.044...)
- Posterior, after normalising: (A=0, B=0.77, C=0.23)
We are now slightly more confident that the app being used is B, but with reasonable uncertainty between B and C. If the second button observed had instead been “6", the posterior would have assigned all probability to C and zero to all the other apps — because no other app could have generated a button press with label “6".
Continuous variables
When we want to deal with continuous variables and cannot exhaustively enumerate values, there are technical snags in extending the idea of counting; but modern inference software makes it easy to extend to a continuous world with little effort. These basic Bayesian concepts put very little restriction on the kinds of problems that we can tackle.
A continuous example
When might we encounter continuous variables? Imagine we have an app that can show social media feeds at different font sizes. We might have a hypothesis that reading speed changes with font size. If we measure how long a user spent reading a message, what font size were they using (Figure 7)?
We can't enumerate all possible reading times or font sizes, but we can still apply the same approach by assuming that these have distributions defined by functions which we can manipulate. A single measurement will in this case give us very little information because the inter-subject variability in reading time drowns out the useful signal; but sufficient measurements can be combined to update our belief.
A Bayesian machine
At the heart of a Bayesian inference problem, we can imagine a probabilistic simulator as a device like Figure 8. This is a simulator that is designed to mimic some aspect of the world. The behaviour of the simulator is adjusted by parameters, which specify what the simulator will do. We can imagine these are dials that we can set to change the behaviour simulation. This simulator can (usually) take a real-world observation and pronounce its likelihood: how likely this observation was to have been generated by the simulator given the current settings of the parameters. It can typically also produce samples: example runs from the simulator with those parameter settings. This simulator is stochastic. One setting of the parameters will give different samples on different runs, because we simulate the random variation of the world. We assume that we have a probability distribution over possible parameter settings — some are more likely than others.
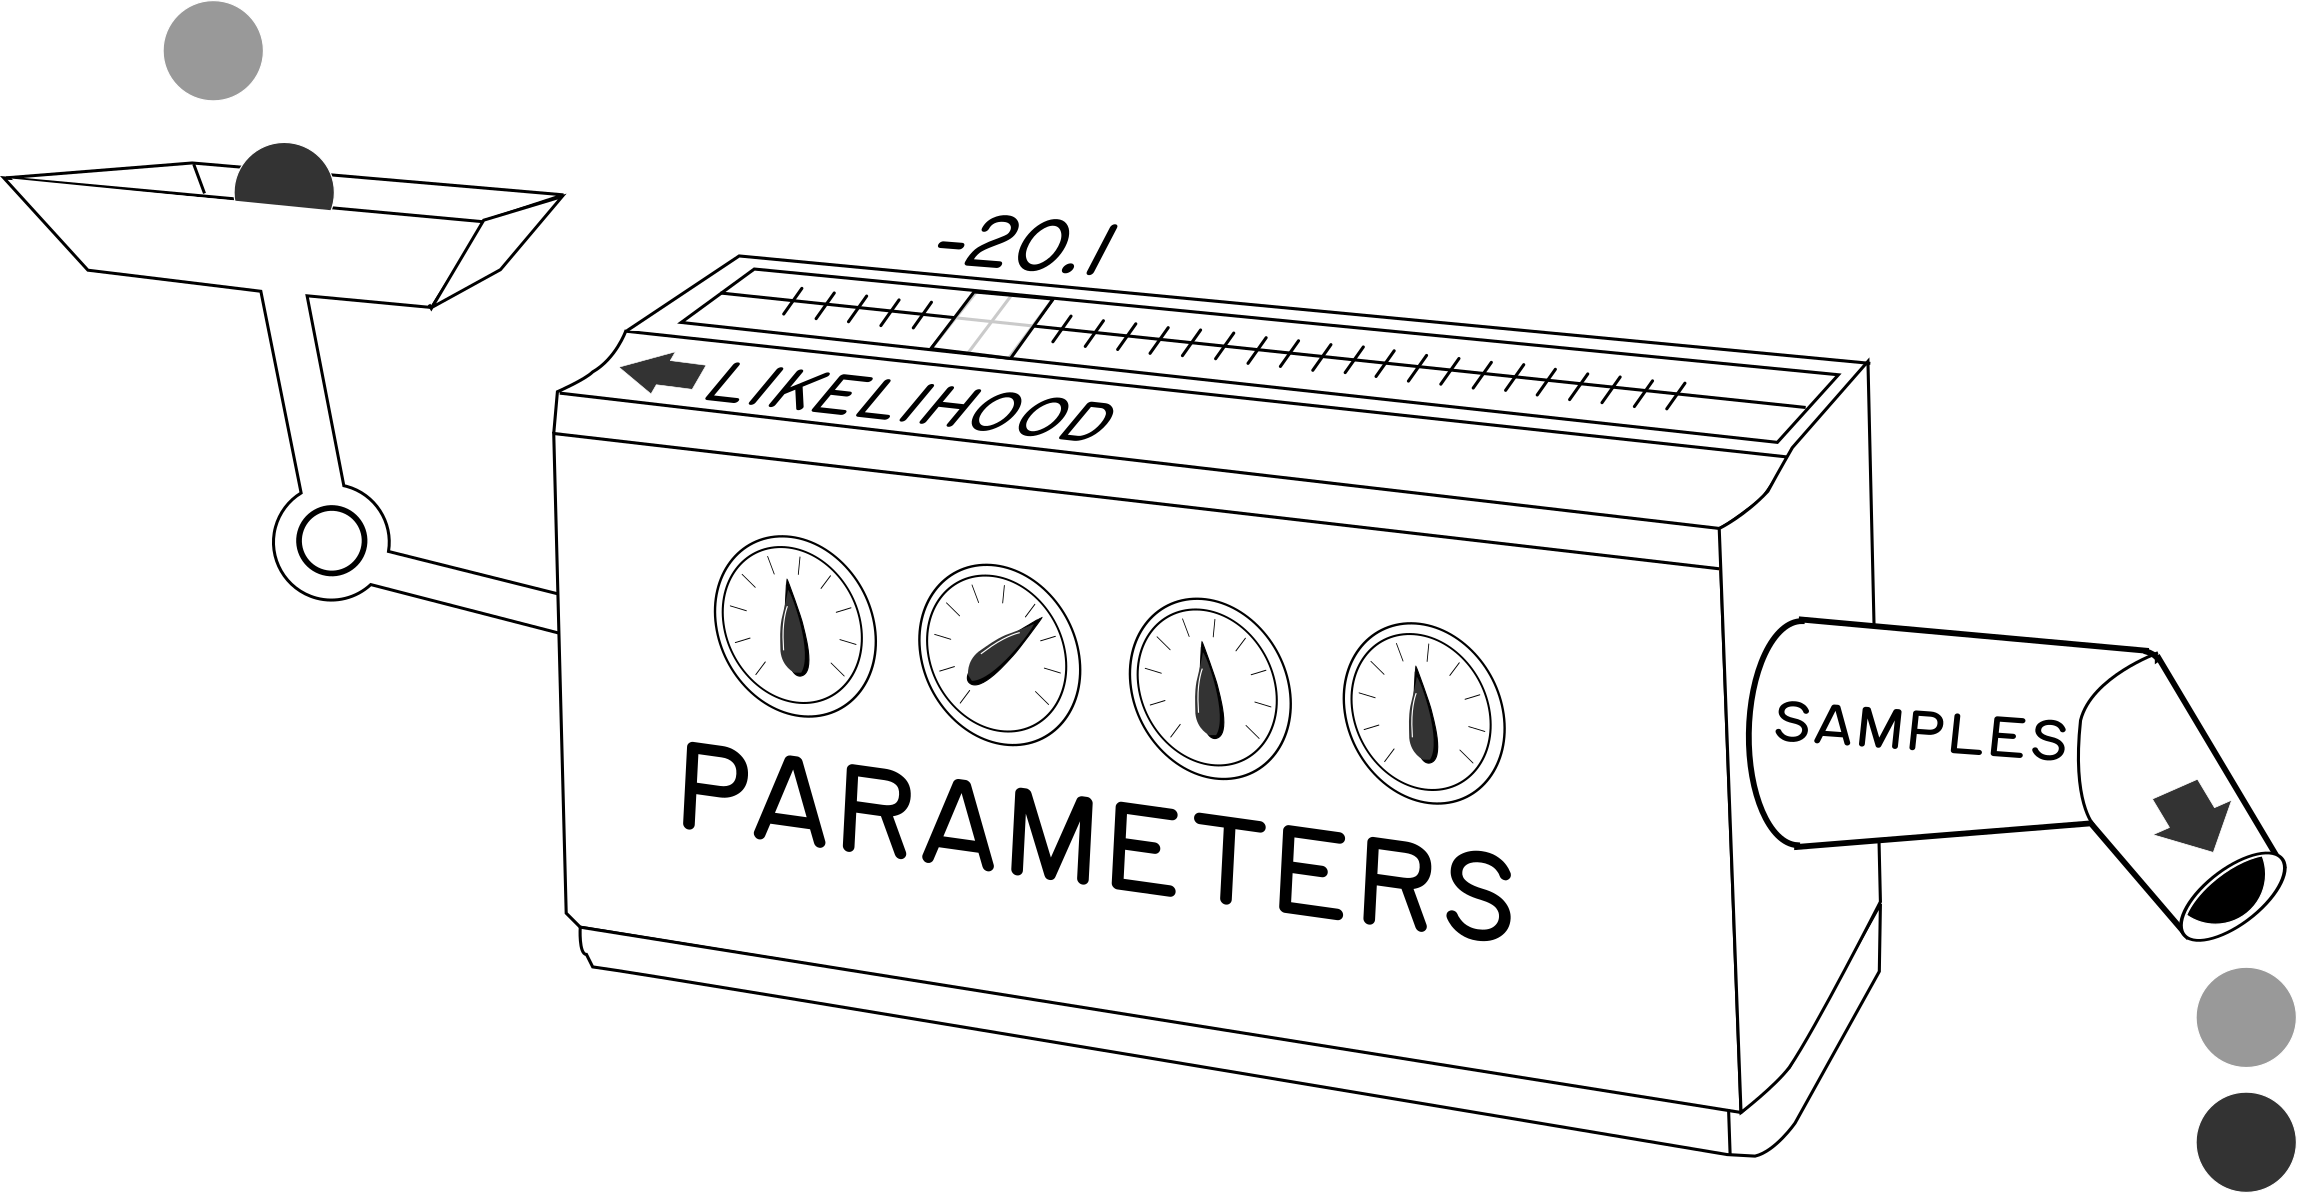
class Simulator:

    def samples(self, parameters, n):
        # return n random observations given parameters
        # (this corresponds to the output on the right)

    def likelihood(self, parameters, observations):
        # return the likelihood of some observation
        # *given the parameters* (i.e. dial settings)
        # (this corresponds to the input on the left)
The basic generative model, sketched in Python.
Inference engine
An inference engine can take a simulator like this and manage the distributions over the parameters. This involves setting prior distributions over the parameters, and performing inference to compute posterior distributions using the likelihood given by the simulator. Parameter values drawn from the prior or posterior can be translated into synthetic observations by feeding them into the simulator, generating samples from the distribution known as the posterior (or prior) predictive. We can also compute summary results using expectations. To compute an expectation, we pass a function, and the inference engine computes average value of that function evaluated at all possible parameters, weighted by how likely that parameter setting is.
The inference engine inverts the simulator. Given observations, it updates the likely settings of parameters.
A reading time simulator
For example, we might model the reading time of the user based on font size, as in the example in Section 3.1.2. The simulator might have three “dials” to adjust (parameters): the average reading time, the change in reading time per point of font size, and the typical random variation in reading time. This is a very simplistic cartoon of reading time, but enough that we can use it to model something about the world. By tweaking these parameters we can set up different simulation scenarios.
import scipy.stats as st
import numpy as np

class ReadingTimeMachine:
    # store the initial parameters
    def __init__(self, mean_time,
                    font_time, std_time):
        self.mean_time = mean_time
        self.font_time = font_time
        self.std_time = std_time


    # given a font_size, generate
    # n random simulations by drawing from
    # a normal distribution
    def simulate(self, n, font_size):
        model = st.norm(self.mean_time +
                        self.font_time * font_size,
                        std_time)

        return model.rvs(n)

    # given a list of reading times and font sizes
    # compute how likely a
    # (reading_time, font_size) pair is
    # under the current parameters. Return the sum
    # of the log likelihood. The log is only used
    # to make computations more numerically stable.
    def log_likelihood(self, reading_times,
                            font_sizes):
        llik = 0
        for time, size in zip(reading_times, font_sizes):
                model = st.norm(self.mean_time +
                                self.font_time * size,
                                self.std_time)
                llik += model.logpdf(time)
        return llik
If we set the dials to “average time=500ms, font time=10ms/pt, variation=+/-100ms” and cranked the sample output with font size set to 12 (i.e.called simulate(n, font_size=12)), the machine would spit out times: 600.9ms, 553.3ms, 649.2ms...
If we fed the machine an observation, say 300ms and font size 8, it would give a (log)-likelihood (e.g. via log_likelihood([300], [9]) = -9.7 for the settings above); given another observation, say 1800ms, it would give a much smaller value (−72.7, in this example), as such an observation is very unlikely given the settings of the machine.
Inference
One traditional, non-Bayesian approach to using this machine would be to feed it a bunch of data into the likelihood inlet, and then iteratively adjust the parameters until the data was “as likely as possible” — maximum likelihood estimation (MLE). This optimisation approach would tweak the dials to best approximate the world (a model can never reproduce the world; but we can align its behaviour with the world).
Bayesian inference instead puts prior distributions on the parameters, describing likely configurations of these parameters. Then, given the data, it computes how likely every possible combination of the parameters is by multiplying the prior by the likelihood of each sample. This gives us a new set of distributions for the parameters which is more tightly concentrated around settings that more closely correspond to the evidence.
What's the difference? In the optimisation (MLE) case, imagine we are using the reading time machine, and we have only observation from one user, of 50,000ms at font size 12. What is the most likely setting of the machine given this data? It will be a very unrealistic average time, a very large font size time, or an extremely large variation; any combination is possible.
A Bayesian model would have specified likely distributions of the parameters in advance. A single data point would move these relatively little, especially one so unlikely under the prior distributions. We'd have to see lots of observations to be convinced that we'd really encountered a population of users who took fifty seconds to read a sentence.
Data space and parameter space
In Bayesian modelling, it is important to distinguish the data space of observations and the parameter space of parameters in the model. These are usually quite distinct. In the example above, the observations are in a data space of reading times, which are just single scalar values. Each model configuration is a point in a three dimensional parameter space (mean_time, font_time, std_time). Both the prior and the posterior are distributions over parameter space. Bayesian inference uses values in observation space to constrain the possible values in parameter space to move from the prior to the posterior. When we discuss the results of inference, we talk about the posterior distribution, which is the distribution over the parameters (dial settings on our machine).
The posterior predictive is the result of transforming the parameter space back into distribution of simulated observations in the data space. We could imagine getting these samples by repeatedly randomly setting the parameters according to the posterior distribution, then cranking the sample generation handle to simulate outputs. The observations would be measured reading times. The prior and posterior of the reaction times would be a distribution over (mean_time, font_time, std_time). The posterior predictive would be again be a distribution over reading times.
Types of uncertainty: aleatoric and epistemic
This brings up a subtlety in Bayesian modelling. We have uncertainty about values, because the simulator, and the world it simulates, is stochastic; given a set of fixed parameters, it generates plausible values which have random variation. But we also have uncertainty about the settings of the parameters, which is what we are updating during the inference process. The inference process is indirect in this sense; it updates the “hidden” or “latent” parameters that we postulate are controlling the generative process. For example, even if we fix the parameters of our reading-time simulator, it will emit a range of plausible values. But we don't know the value of the parameters (like font time), and so there is a distribution over these as well.
We can classify uncertainties: aleatoric uncertainty, arising from random variations, that cannot be eliminated by better modelling; and epistemic uncertainty, arising from our uncertainty about the model itself. In most computational Bayesian inference, we also have a third source of uncertainty: approximation uncertainty. This arises because most methods for performing Bayesian inference do not compute exact posterior distributions and this introduces an independent source of variation. For example, many standard inference algorithms applied same model and same data twice would yield two different approximate posteriors, assuming the random seed was not fixed. The approximation error should be slight for well behaved models but can be important, particularly for large and complex models where few samples can be obtained for computational reasons.
- aleatoric random noise in observations (e.g. random reading times given fixed parameters); modelled by the likelihood
- epsitemic unknown state of parameters or model structure; modelled by the parameter distribution
- approximation error in parameter estimates due to computational approximations; e.g. as introduced by Monte Carlo sampling.
Bayesian approaches
What are the key ideas in Bayesian approaches?
There are some distinctive aspects of Bayesian approaches that distinguish them from other ways of solving problems in interaction design. We summarise these briefly, to give a flavour of how thinking and computation change as we move to a Bayesian perspective.
Beliefs are probabilities
A Bayesian represents all beliefs as probabilities. A belief is a measure of how likely a configuration of a system is. A probability is a real number between 0 and 1. Larger numbers indicate a higher degree of certainty. Manipulation of belief comes down to reassigning probabilities in the light of evidence.
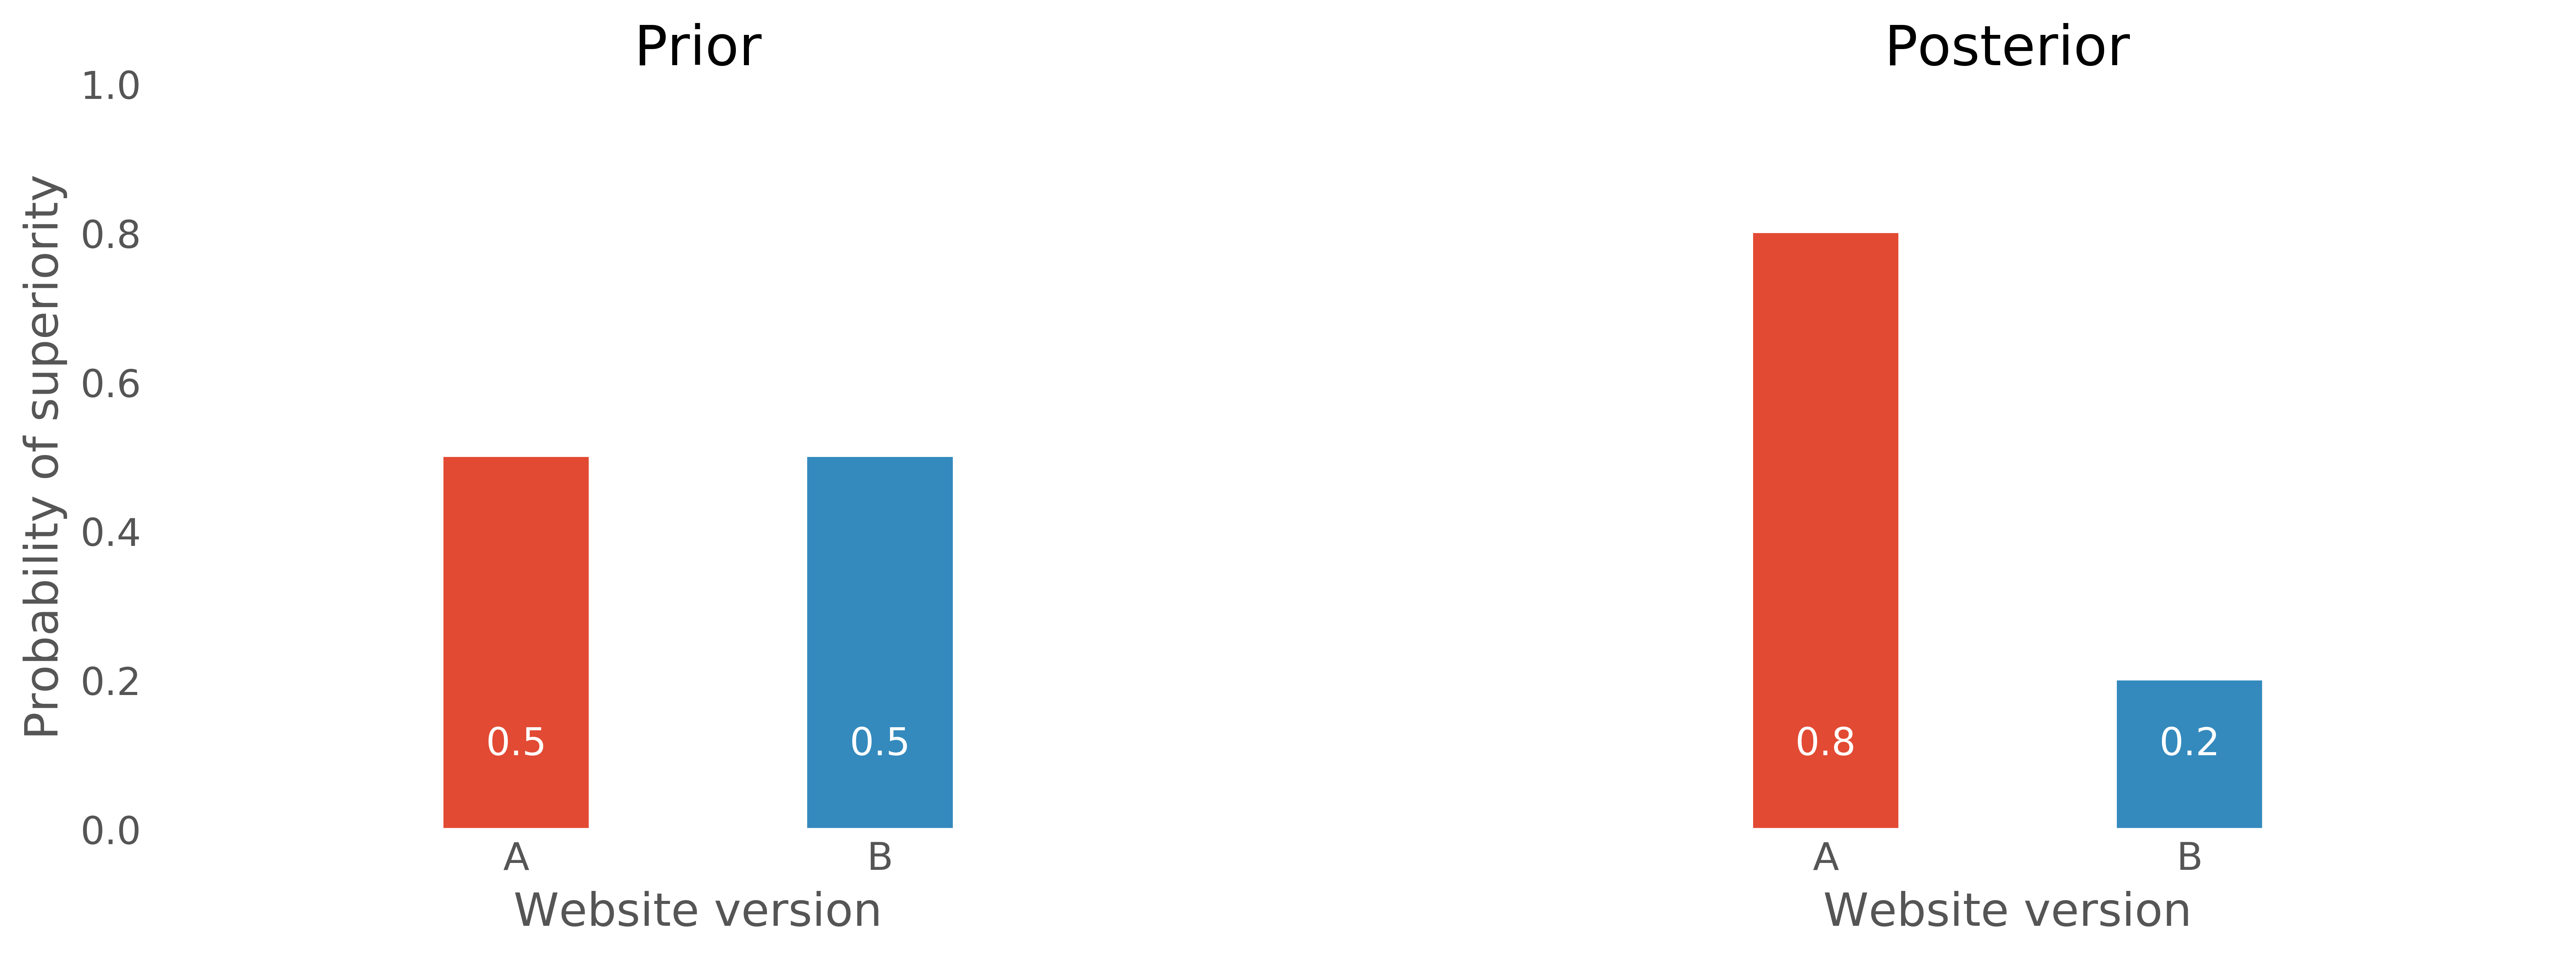
For example, we might have a belief that two versions, A and B, of a website have different “comprehension” scores, but we have no idea which is better, if any. We could represent this as a probability distribution, perhaps a 50/50 split in the absence of any further information: {A_\text{better}=0.5, B_\text{better}=0.5}. We could make observations, by running a user trial and gathering data, and form a new belief {A_\text{better}=0.8, B_\text{better}=0.2}. Whether version A or B is better is not a knowable fact (there isn't any possible route to precisely determine it), nor is it the result of some long sequence of identical experiments. Instead it is just a quantified belief. We used to believe that version A was as likely to be as good as B; we now believe that A is probably better (Figure 9).
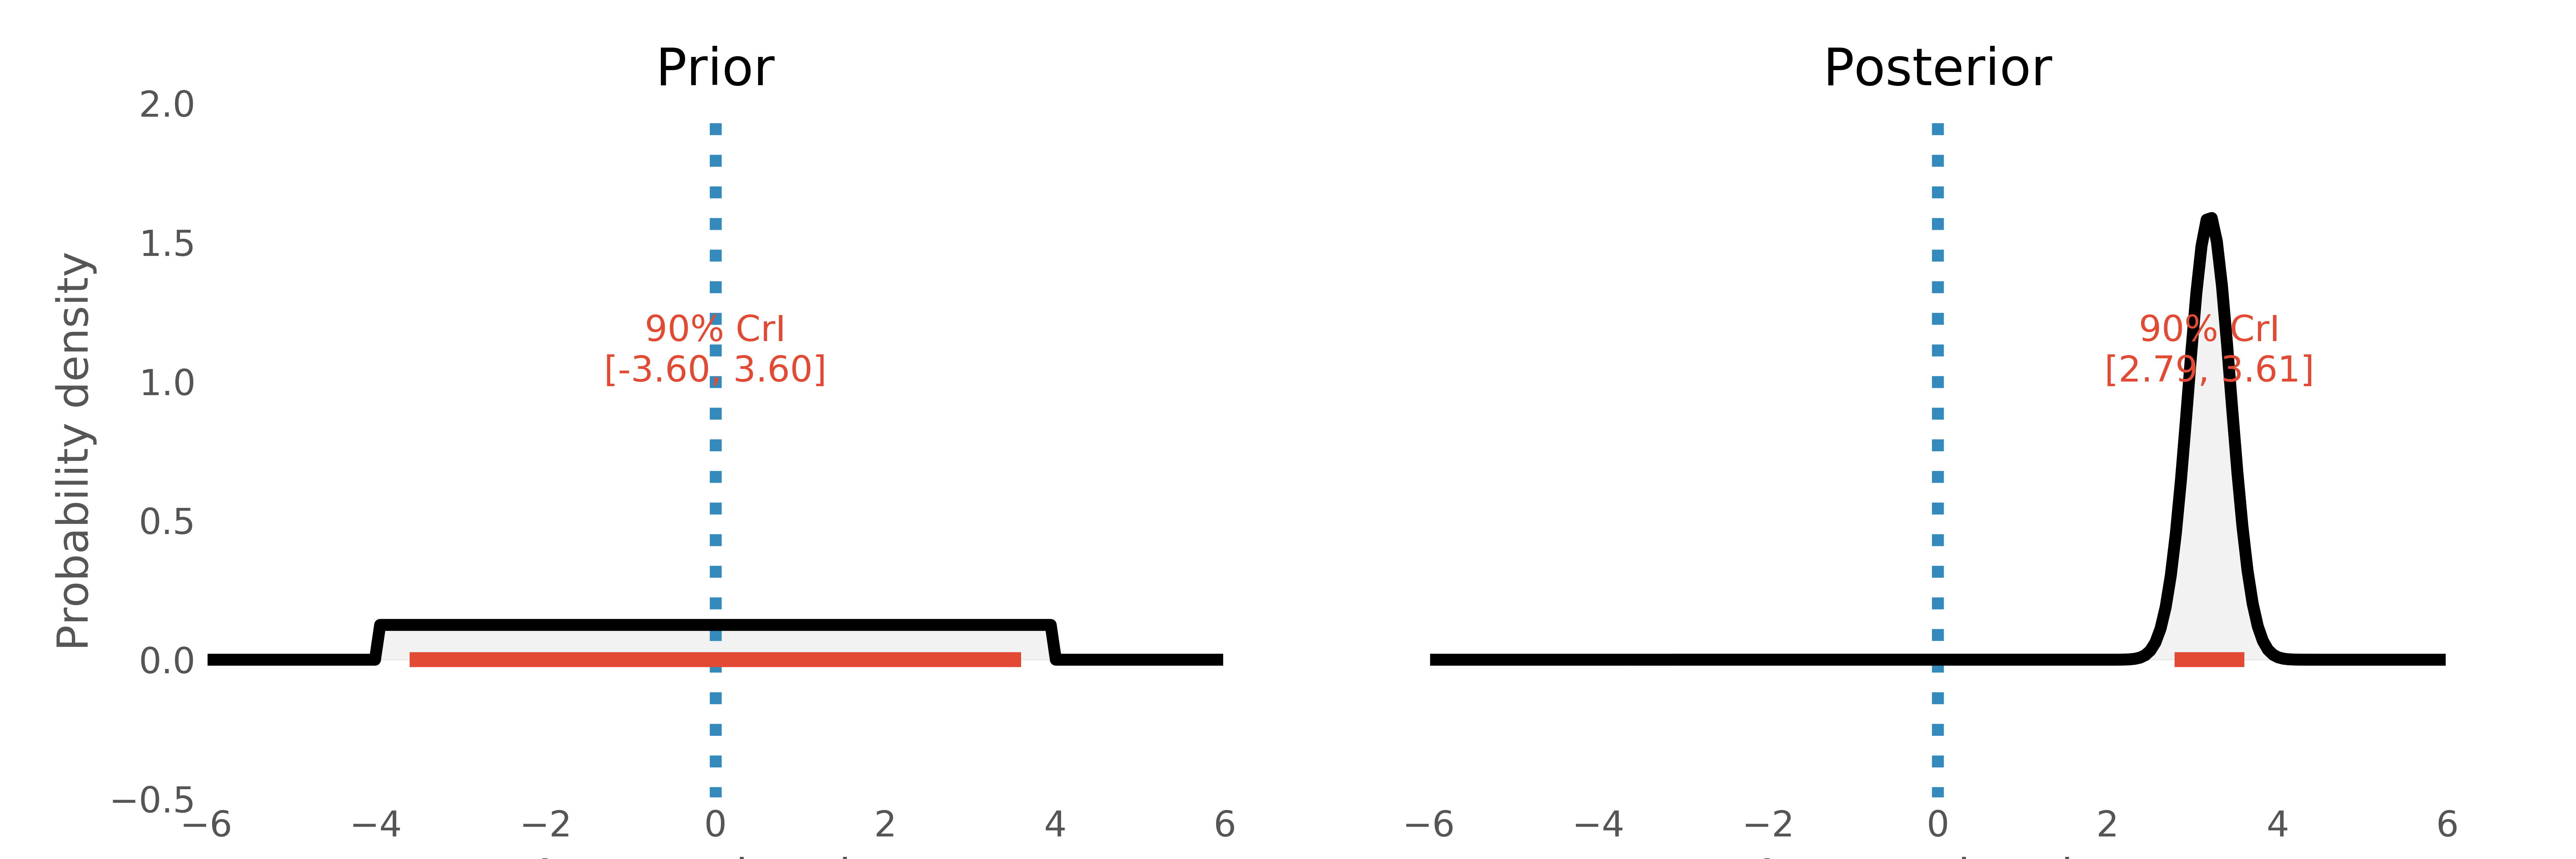
If we went further, we might quantify how much better A was than B on some scale of relative comprehension, and represent that as a probability distribution. Perhaps we'd assume that A could be anywhere from [-4, 4] units of comprehension better than B. After doing an experiment, this might be concentrated with 90% of the probability now in the range [2.7, 3.6] (Figure 10).
Representing a full distribution like this can be much more enlightening than a dichotomous approach that only considers the relative superiority of one belief above another. For example, we might know that each unit of increased comprehension is “worth” ten extra repeat visits to our website. We can now make concrete statements like “we expect around 32 additional return visits with version B” directly from the posterior distribution. Representing distributions over many hypotheses can make decisions much easier to reason about.
Distributions, not points
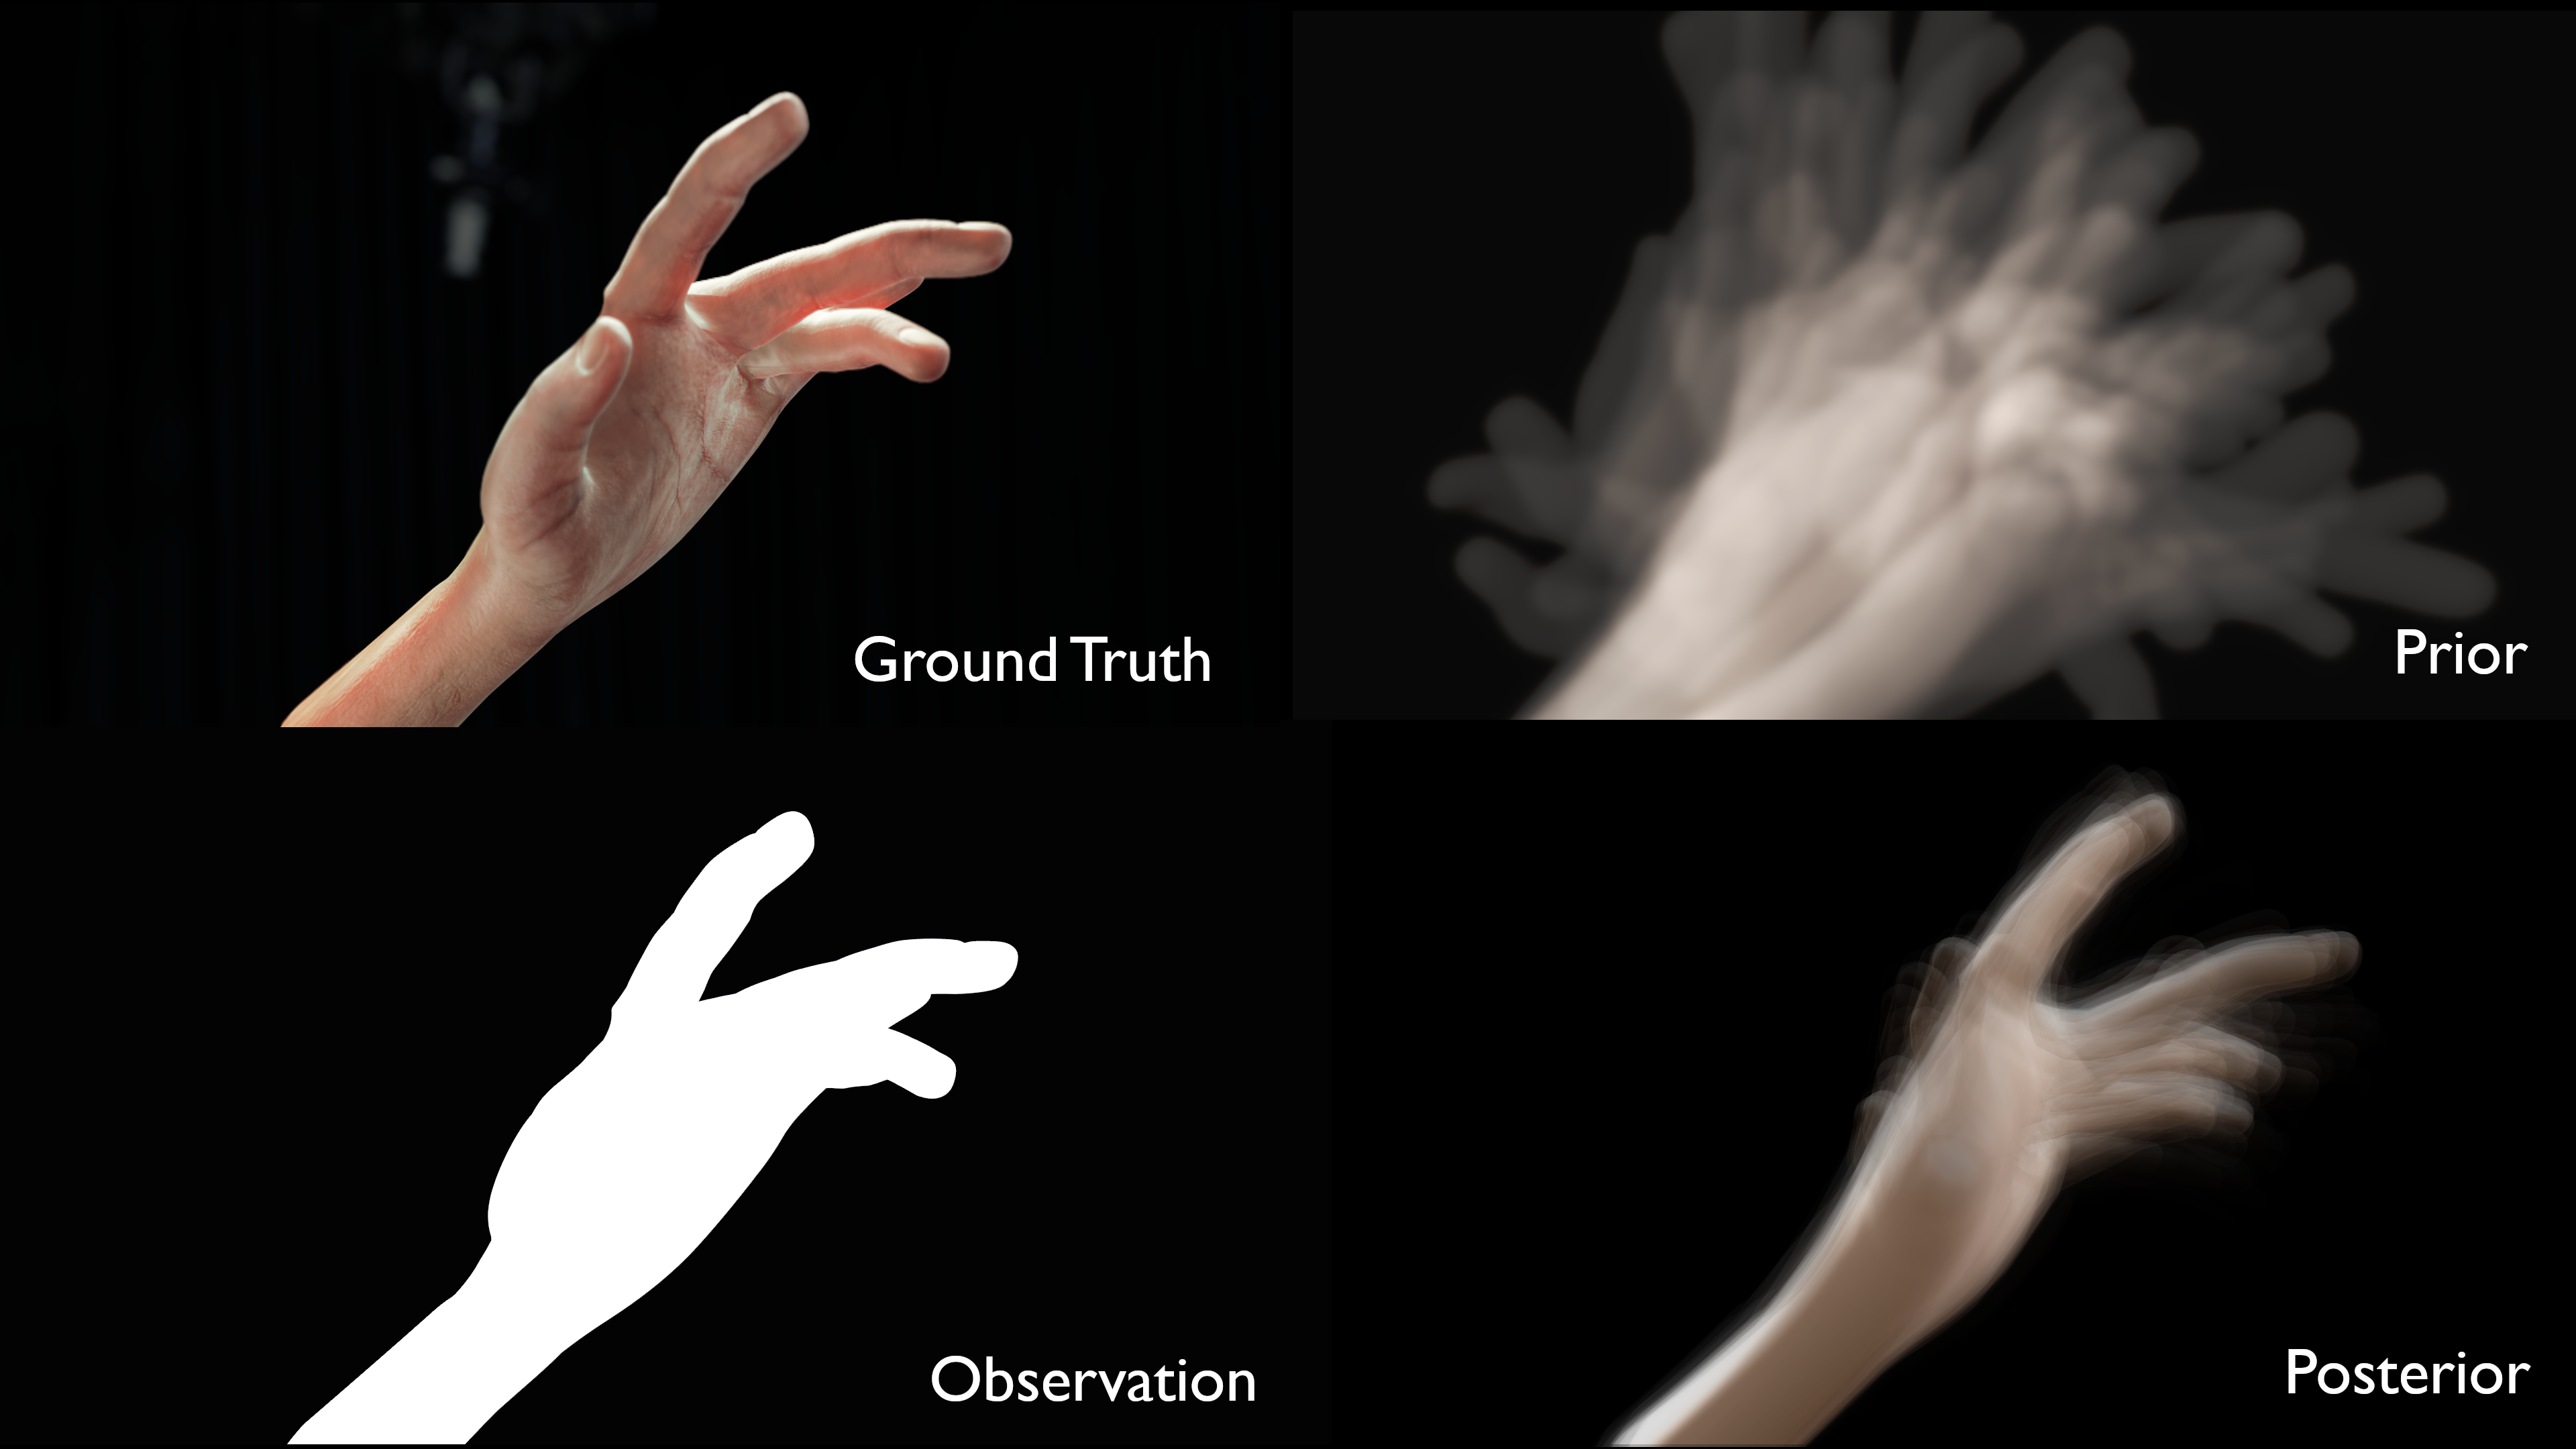
To be Bayesian, we work not with definite values but distributions over possible values. For example, we would not write code to find the best estimate of how long a user takes to notice a popup, or optimise to find the geometrical configuration of the hand pose that is most compatible with a camera image. That is not congruent with a Bayesian world-view which deals exclusively with beliefs about configurations. Instead, we would consider a distribution over all possible times, or all possible poses (Figure 11). After we update this with evidence (e.g. by running a user evaluation and showing lots of popups), we expect our distribution to have contracted around likely configurations. Wherever possible, we keep our beliefs as full distributions and avoid at all times reducing them to point estimates, like the most likely configuration.
This has several consequences:
- We always explicitly have a representation of uncertainty.
- We have a universal language (or data type) with which we reason — the probability distribution.
- The probability distribution is a data type that is hard to work with, and consequently we often have to rely on approximations to do computations.
- We need to be able to summarise and visualise distributions to report them.
It is hard to communicate directly about distributions, so they are often reported using summary statistics, like the mean and standard deviation, or visualised with histograms or Box plots. Bayesian posterior distributions are often summarised in terms of credible intervals (CrI). These are intervals which cover a certain percentage of the probability mass or density. For example a 90% credible interval defines an interval in which we believe that an unknown parameter lies with 90% certainty (given the priors).
Approximation is king
Probability distributions are hard to work with. As a consequence almost all practical Bayesian inference relies on approximations. Much of the traditional complexity of Bayesian methods comes from the contortions required to do manipulate distributions. This has become much less tricky now that there are software tools that can apply approximations to almost any model at the press of a button.
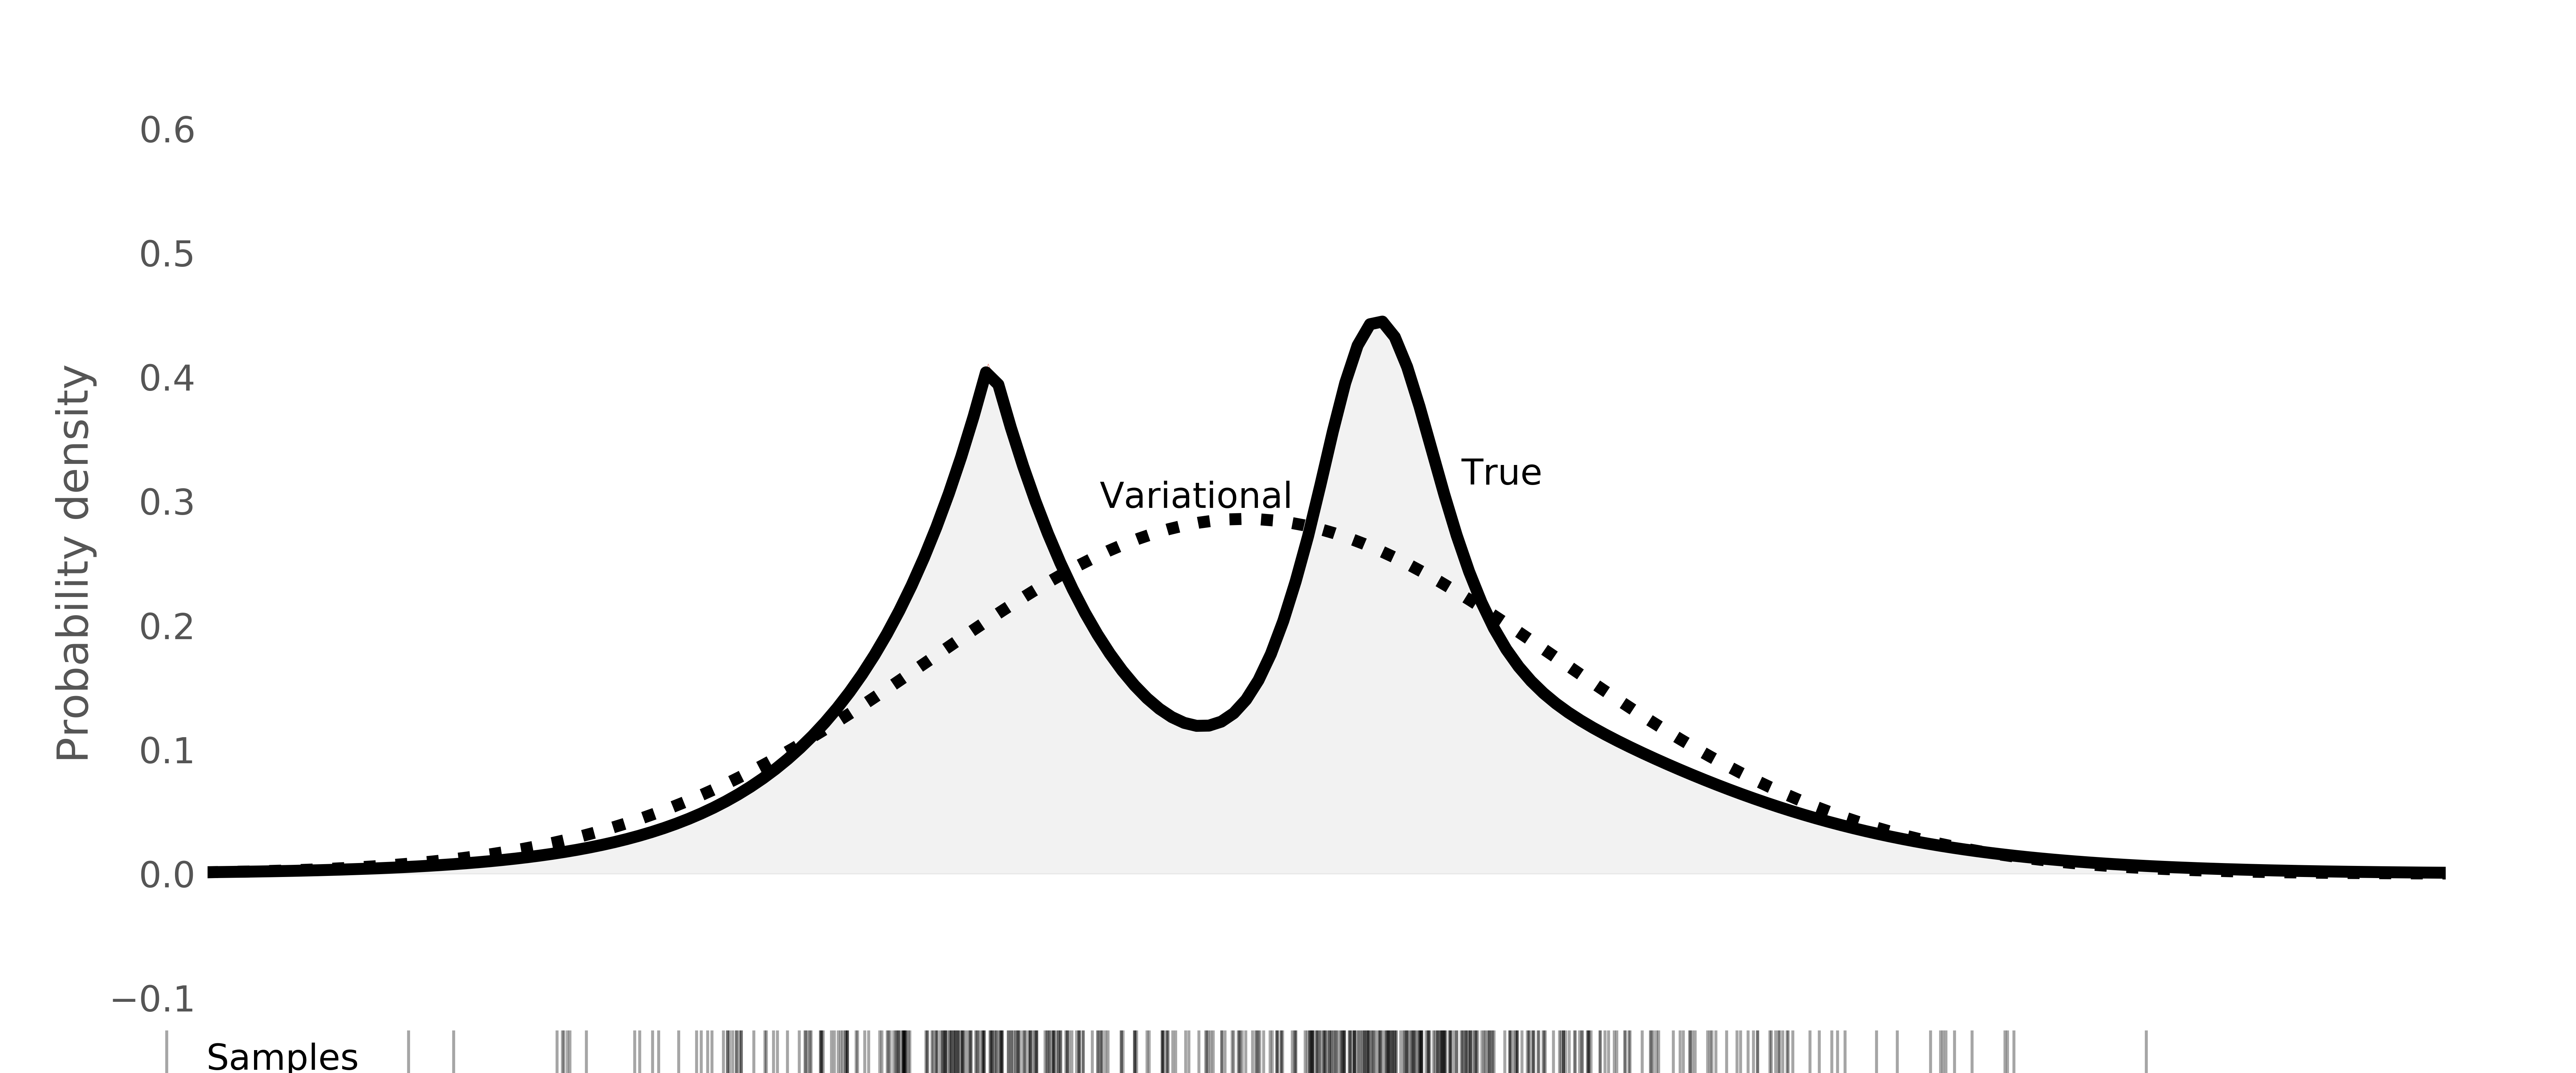
There are several important approximations used in practice, and they can largely be separated into two major classes: variational inference, where we represent a complex distribution with the “best-fitting” distribution of a simpler one; and sample-based methods, where we represent distributions as collections of samples; definite points in parameter space (Figure 12).
Approximations can sometimes confound the use of Bayesian models. The obvious, pure way to solve a problem may not mesh well with the approximations available, and this may motivate changes in the model to satisfy the limitations of computational engines. This problem is lessening as “plug and play” inference engines become more flexible, but it is often an unfortunate necessity to think about how a model will be approximated.
Integrate, don't optimise
As a consequence of the choice to represent belief as distribution, our techniques for solving problems are typically to integrate over possible configurations, rather than to optimise to find a precisely identified solution.
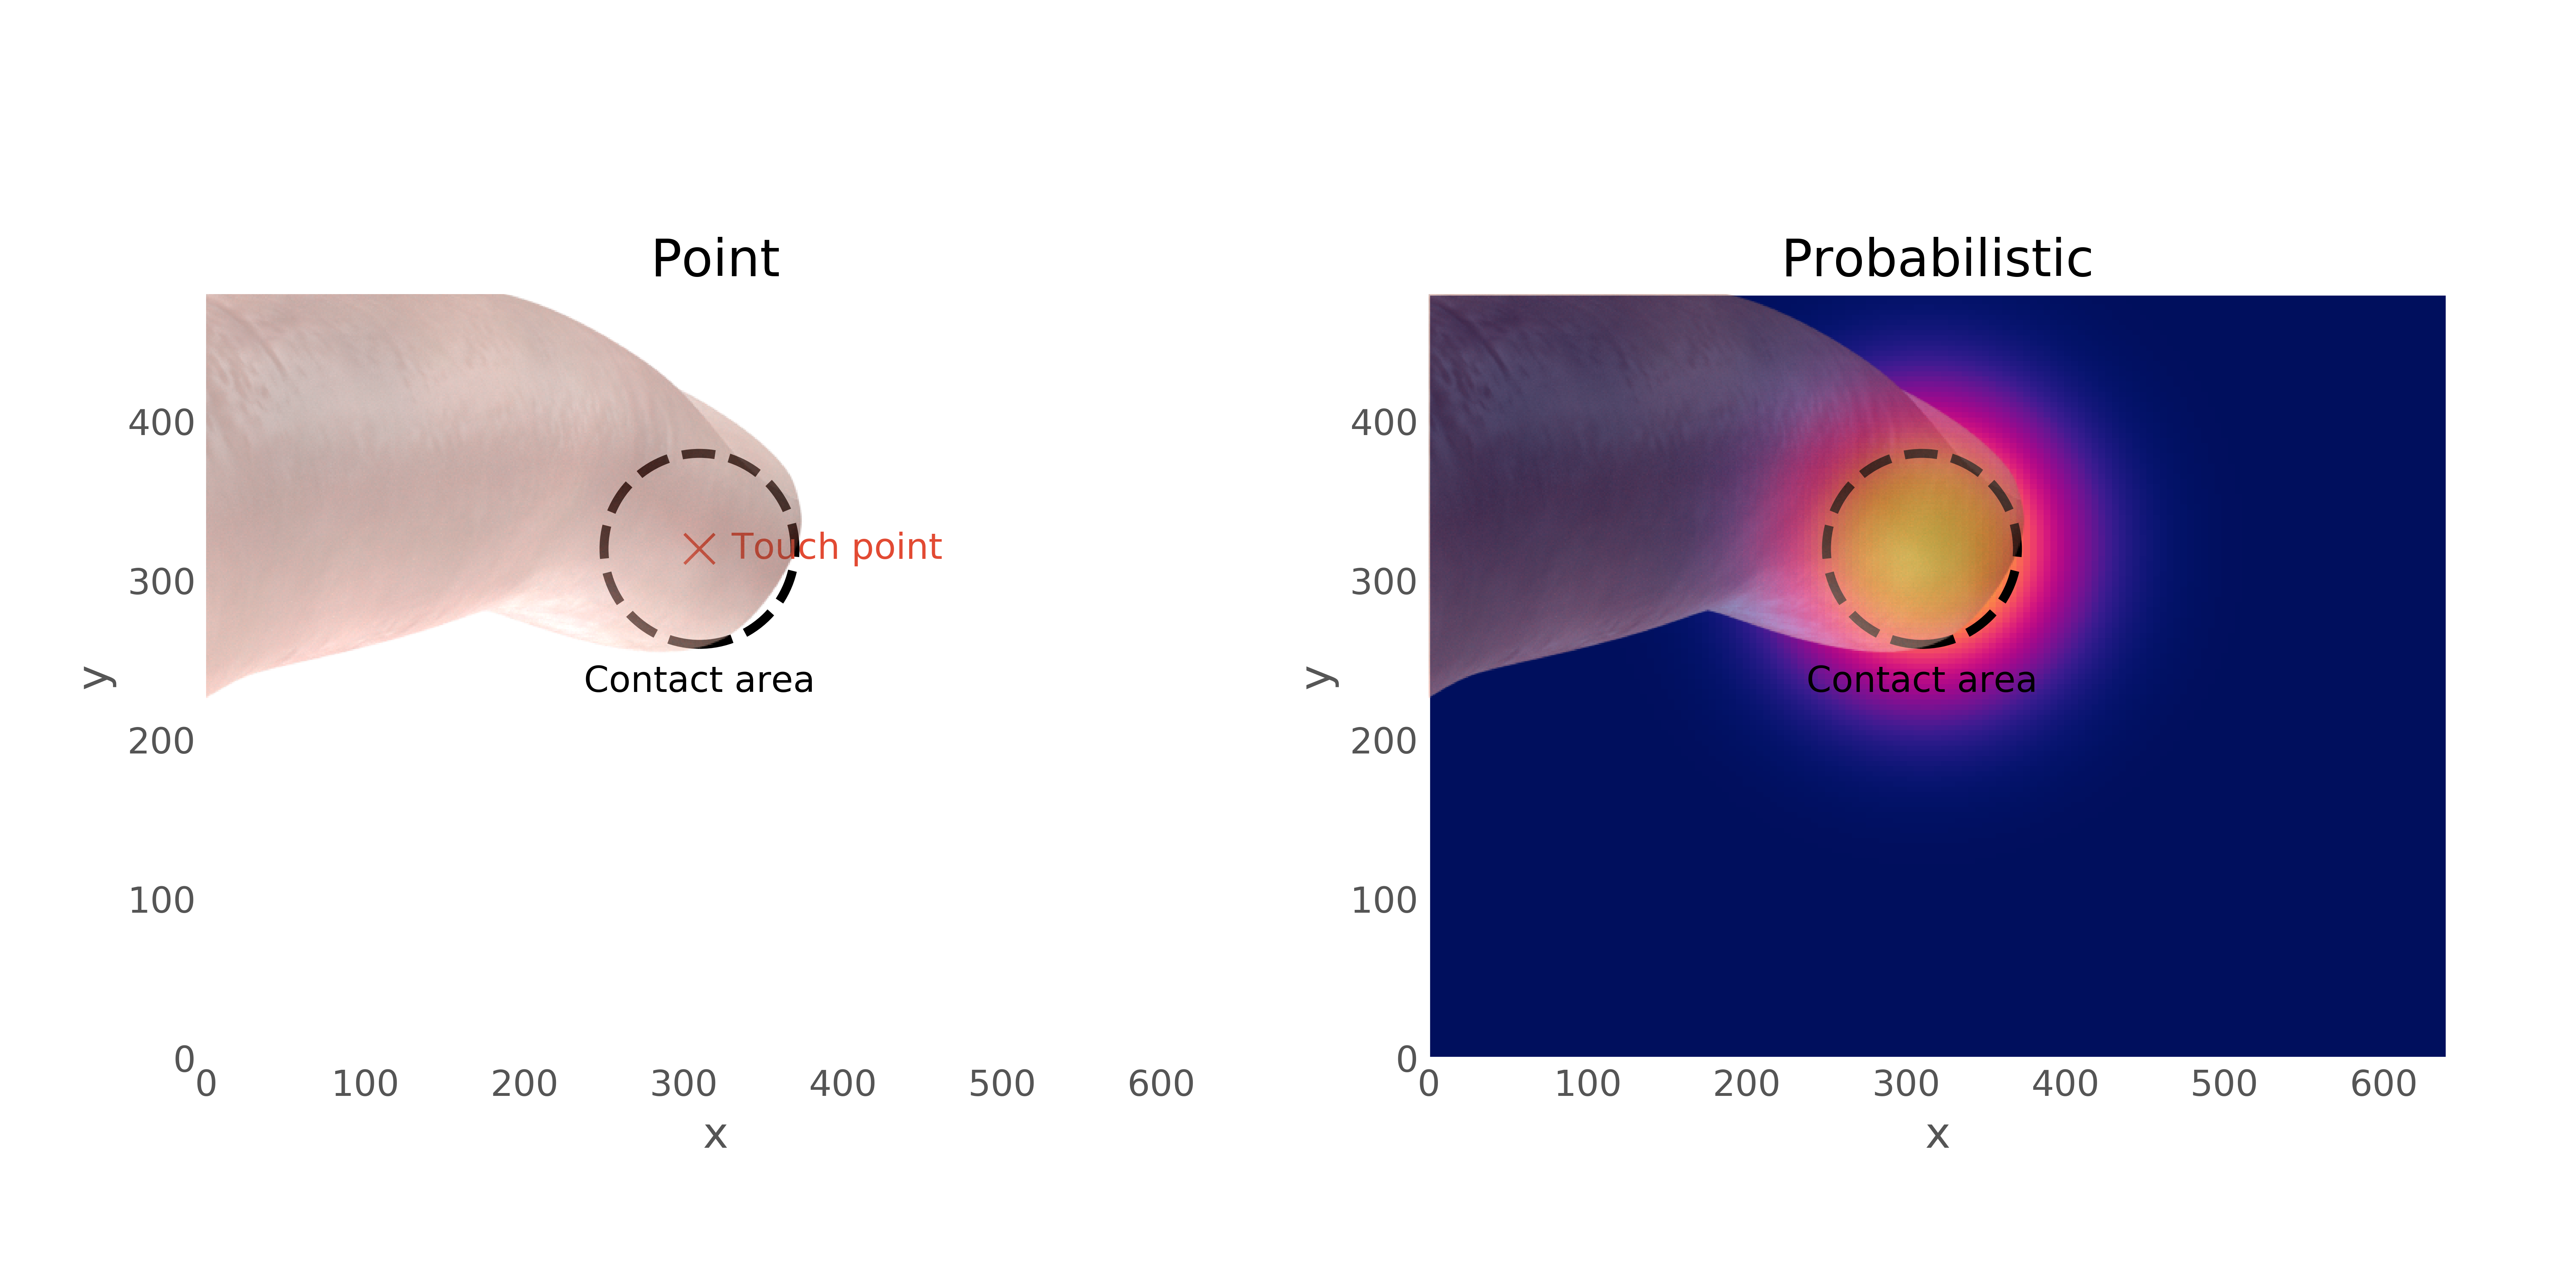
For example, imagine a virtual keyboard that was interpreting a touch point as a keypress. We might model each key as being likely to be generated by some spatial distribution of touch points given the size of the user's finger, or more precisely the screen contact area of the finger pad. Depending on how big we believe the user's finger to be, our estimate of which key might have been intended will be different: a fat finger will be less precise.
How do we do identify the key pressed, as a Bayesian? We do not identify the most likely (or even worse, a fixed default) finger size and use that to infer the distribution over possible key presses. Instead, we would integrate over all possible finger sizes from a finger size distribution, and consider all likely possibilities. If we become more informed about the user's finger pad size, perhaps from a pressure sensor or from some calibration process, we can use that information immediately, by refining this finger size distribution (Figure 13).
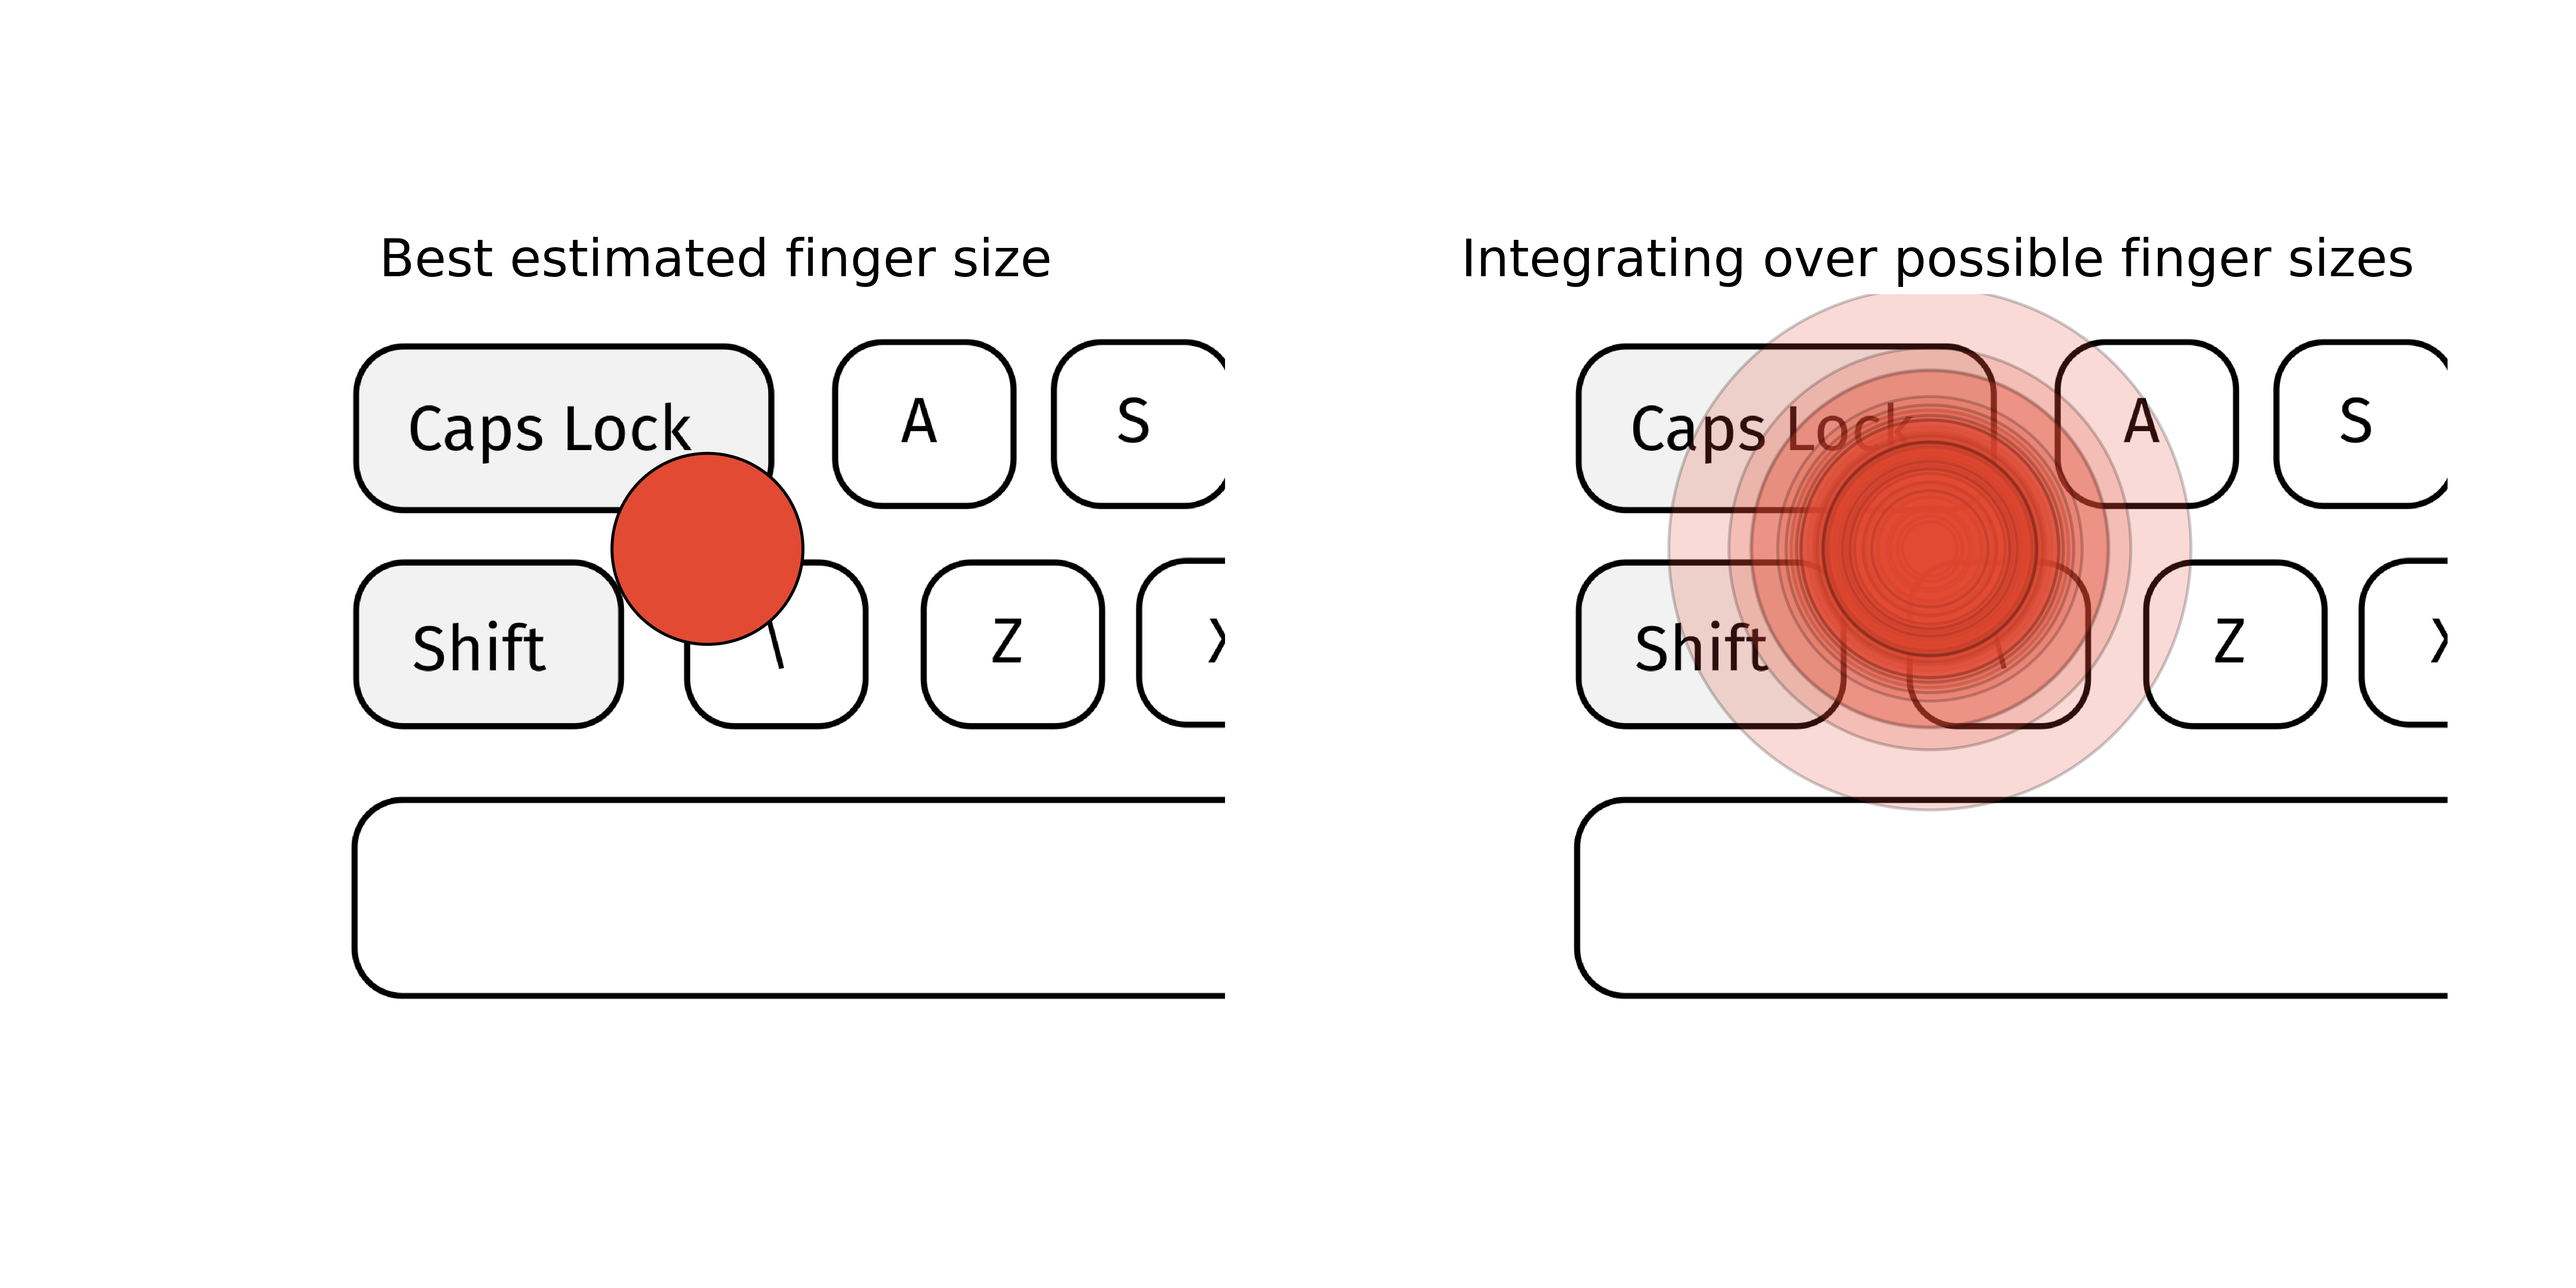
| and Caps Lock and zero elsewhere; right, integrating over possible finger sizes indicates there is some small probability of Shift, and even A or Z. This comes at a cost. As we increase the number of dimensions — the number of parameters we have — the volume of the parameter space to be considered increases exponentially. If we had to integrate over all possible finger sizes, all possible finger orientations, all possible skin textures and so on, this “true” space of possibilities becomes enormous. This makes exhaustive integration computationally infeasible as models become more complex. The reason Bayesian methods work in practice is that approximations allow us to efficiently integrate “where it matters” and ignore the rest of the parameter volume.
Expectations
The focus on integrating means that we often work with expectations, the expected value averaging over all possible configurations weighted by how likely they are. This assumes we attach some value to configurations. This could be a simple number, like a dollar cost, or a time penalty; or it could be a vector or matrix or any value which we can weight and add together.
In a touch keyboard example, we might have a correction penalty for a mis-typed key, the cost of correcting a mistake; say in units of time. What is the expected correction penalty once we observe a touch point? We can compute this given a posterior distribution over keys, and a per-key correction cost. Assume the key actuated is the key with highest probability, k_1. For each of the other keys, k_2, \dots, k_n we can multiply the probability that key k_i was intended by the penalty time it would take to correct k_1 to k_i. It is then trivial to consider the expected correction cost if some keys are more expensive than others (perhaps backspace has a high penalty, but shift has no penalty).
In an empirical analysis, we might model how an interactive exhibit in a museum affects reported subjective engagement versus a static exhibit. We might also have a model that predicts increase in time spent looking at an exhibit given a reported engagement. Following a survey, we could form a posterior distribution over subjective engagement, pass it through the time prediction model and compute the expected increase in dwell time that interaction brings (e.g. 49.2s additional dwell time).
Bayes' Rule
Bayesian inference updates beliefs using Bayes' rule. Bayes' rule is stated, mathematically, as follows:
P(A|B) = \frac{P(A)P(B|A)}{P(B)},
or in words:
\text{posterior} = \frac{\text{prior} \times \text{likelihood}}{\text{evidence}},
or often simplified to
\text{posterior} \propto \text{prior} \times \text{likelihood}
This means that reasoning moves from a prior belief (what we believed before), to a posterior belief (what we now believe), by computing the likelihood of the data we have for every possible configuration of the model. We combine simply by multiplying the probability from the prior and the likelihood over every possible configuration (Figure 14).
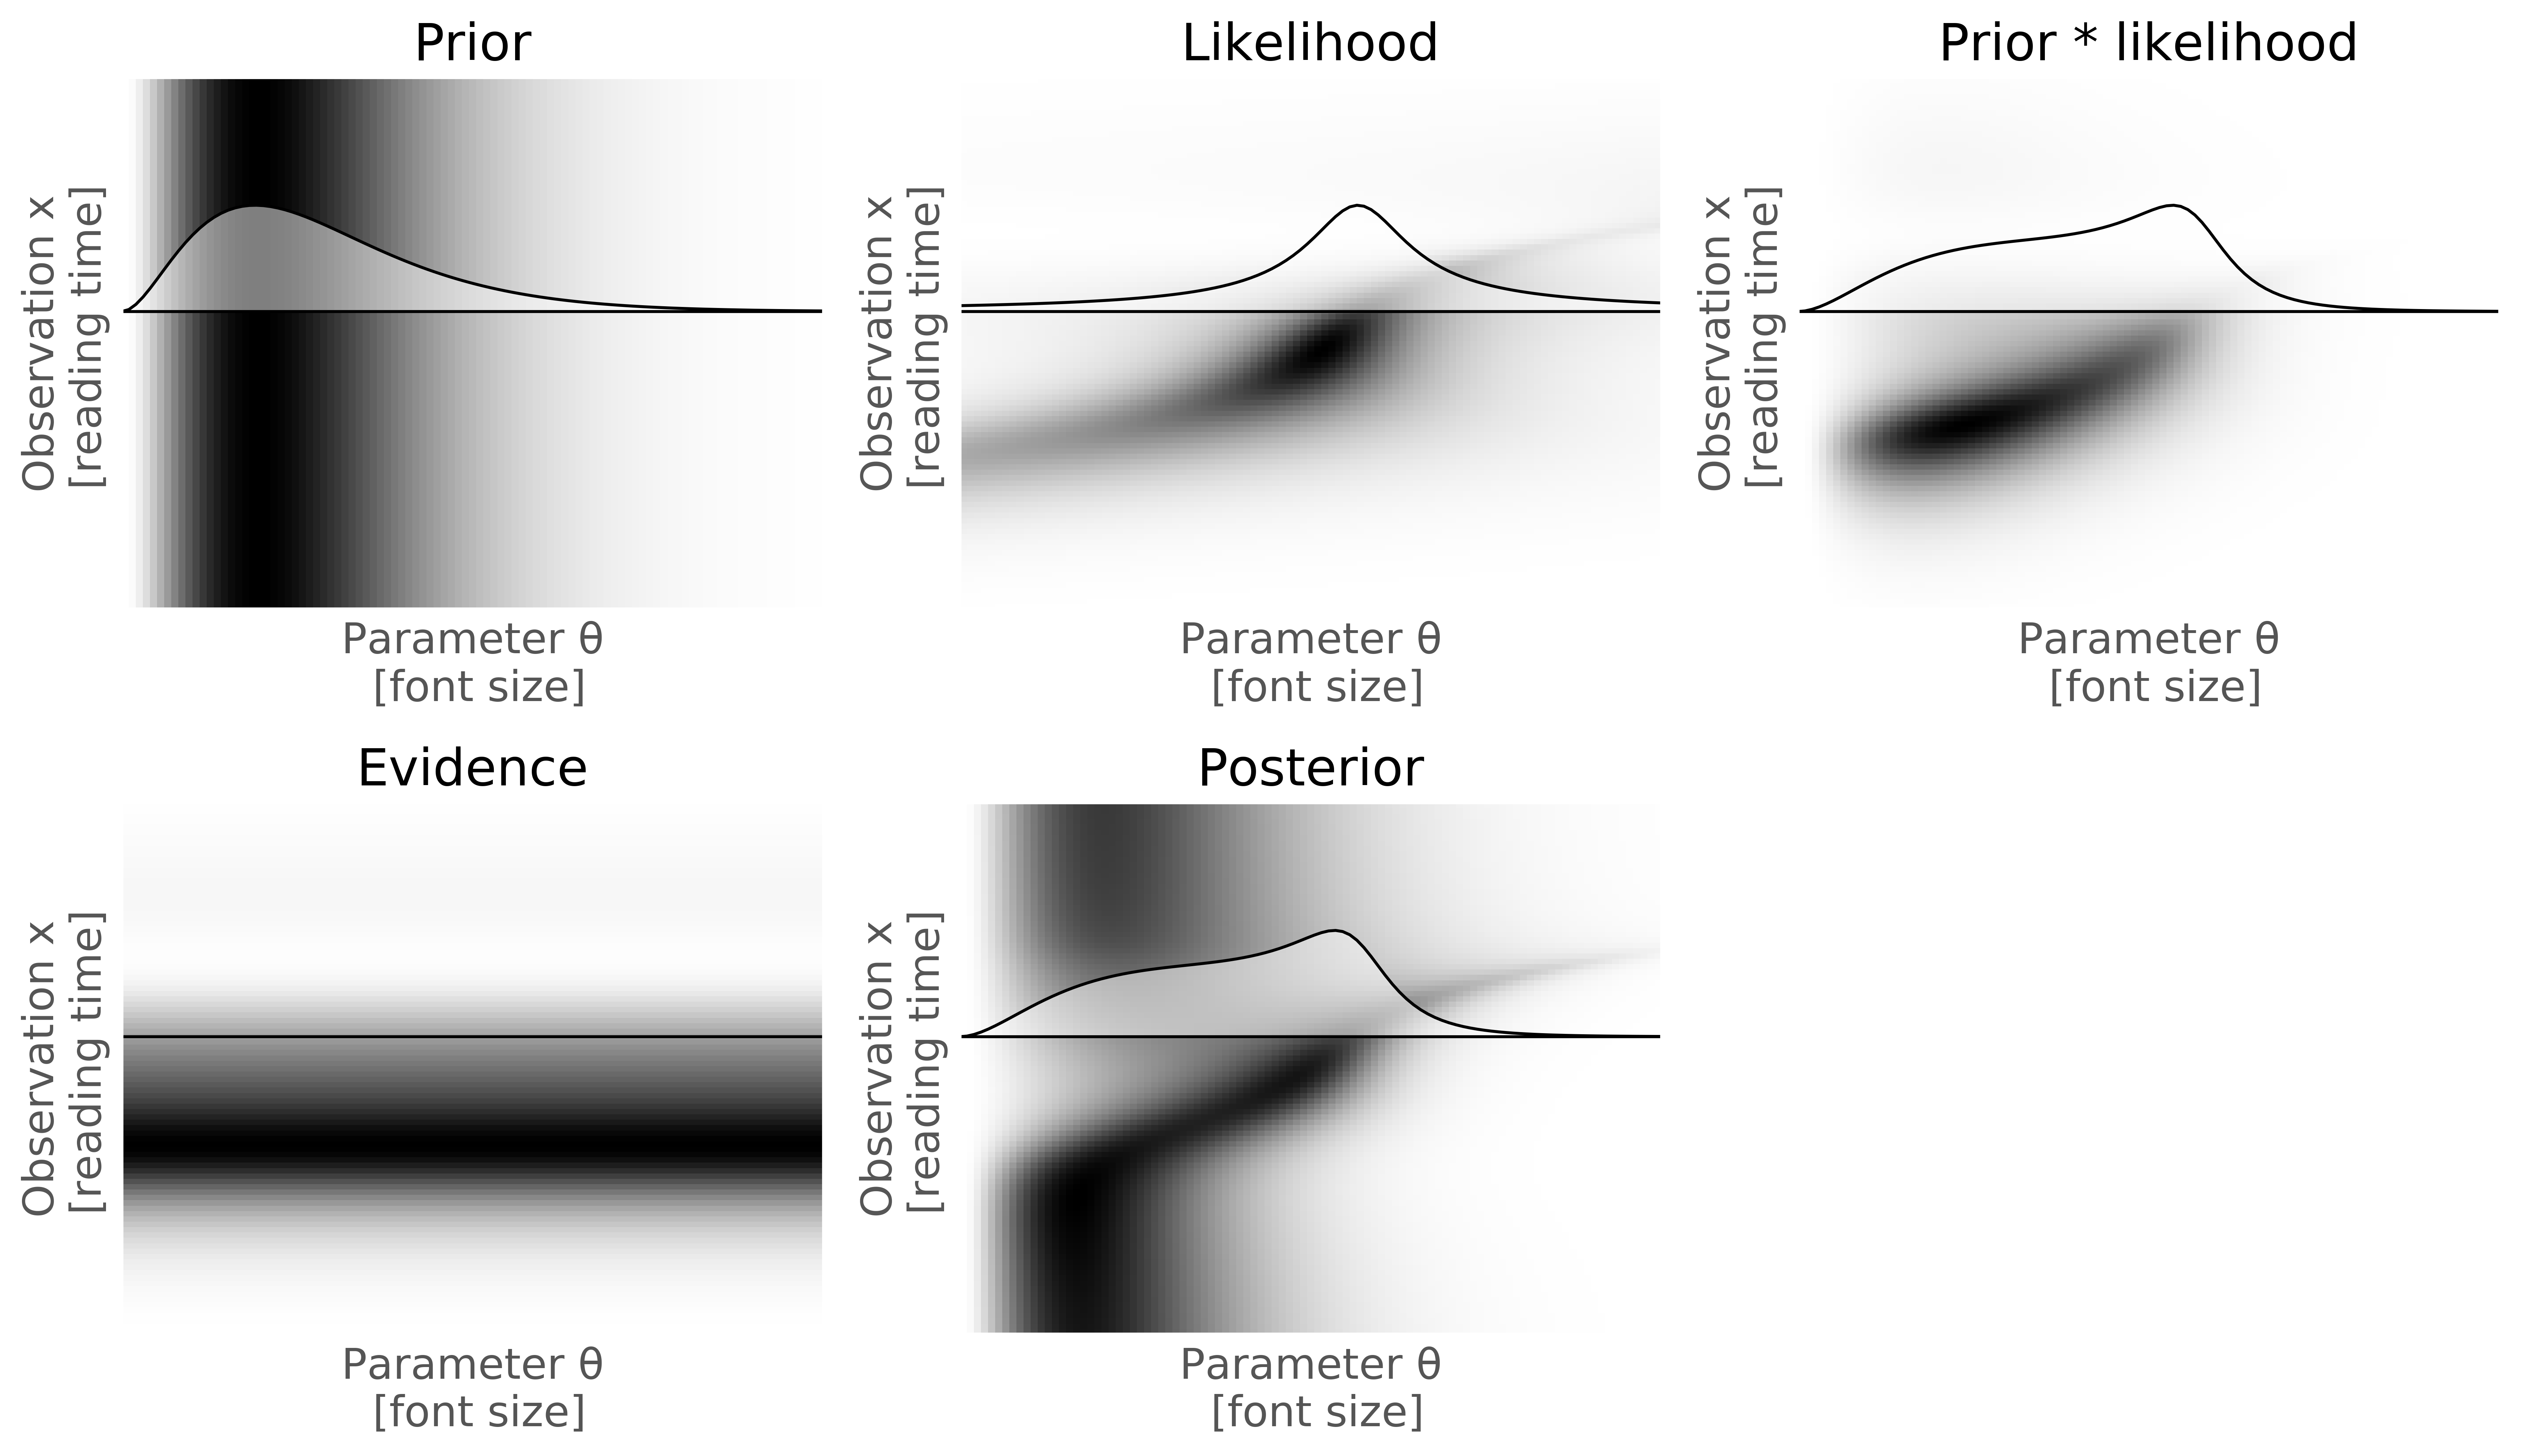
To simplify our representations, and limit what we mean by “every possible configuration” we assume that our models have some “moving parts” — parameters, traditionally collected into a single vector \theta — that describes a specific configurations, in some space of possible configurations. All Bayes' rule tells us that the probability of each possible \theta can be updated from some initial prior belief (quantified by a real number assigned to each configuration of \theta, a probability) via a likelihood (giving us another number) and then normalising the result (the evidence) so that the probabilities of each configuration still add up to 1.
Priors
As a consequence of Bayes' rule, it is necessary for all Bayesian inference to have priors. That is, we must quantify, precisely, what we believe about every parameter before we observe data. This is analogous to traditional logic; we require axioms, which we can manipulate with logic to reach conclusions. It is not possible to reason logically without axioms, nor is it possible to perform Bayesian inference without priors. This is a powerful and flexible way of explicitly encoding beliefs. It has been curiously controversial in statistics, where it is has been criticised as subjective. We will leave the gory details of this debate to others.
Priors are defined by assigning probability distributions to the parameters. Priors can be chosen to enforce hard constraints (e.g. a negative reaction time to a visual stimulus is impossible unless we believe in precognition, so a prior on that parameter could reasonably have probability zero assigned to all negative times), but typically they are chosen so as to be weakly informative — they represent a reasonable bound on what we expect but do not rigidly constrain the possible posterior beliefs. Priors are an explicit way of encoding inductive bias, and the ability to specify a prior that captures domain knowledge grants Bayesian methods its great strength in small data regimes. When we have few data points, we can still make reasonable predictions if supported by an informative prior. Eliciting appropriate priors requires thought and engagement with domain experts.
Latent variables
Bayesian approaches involve inference; the process of determining what is hidden from what is seen. We assume that there are some parameters that explain what we observe but whose value is not known. These are hidden or latent parameters.
For example, if we are building a computer vision based finger pose tracker, we might presume a set of latent variables (parameters) that describe joint angles of the hand, and describe the images that we observe as states generated from the (unknown) true joint angle parameters. Inference refines our estimates of these joint angles following the observation of an image and allows us to establish what hand poses are compatible with the observed imagery. Not which hand pose; but what poses are likely. We never identify latent variables, only refine our belief about plausible values.
Latent variables sometimes have to be accounted for in an inference, even though they are not what we are directly interested in. These are nuisance variables. For example, in the hand tracker, the useful parameters are the joint angles of the hand. But in a practical hand tracker, we might have to account for the lighting of the scene, or the camera lens parameters, or the skin tone. We are not interested in inferring these nuisance variables, but we may have to estimate them to reliably estimate the joint angles.
In a simpler scenario, we might predict how much time a user spends reading a news article on a mobile device as a function of the font size used, and assume that this follows some linear trend, characterised by a slope \beta_1 and a constant offset \beta_0:
\text{read time s} = \beta_1 * \text{font size pt} + \beta_0 + \text{noise}.
\beta_1, \beta_0 are latent variables that describe all possible forms of this line. By observing pairs of read_time and font_size we can narrow down our distribution over the latent variables \beta_0, \beta_1. Obviously, this simplistic model is not a true description of how reading works; but it is still a useful approximation.
In many scientific models there are many more latent variables than observed variables. Imagine inferring the complex genetic pathways in a biological system from a few sparse measurements of metabolite masses — there are many latent parameters and low-dimensional observations. In interaction, we sometimes have this problem: for example, modelling social dynamics with many unknown parameters from very sparse measurements. Often, however, we have the opposite problem, particularly when dealing with inference in the control loop: we have a large number of observed variables (e.g. pixels from an image from camera) which are generated from a much smaller small set of latent parameters (e.g. which menu option does the user want).
Simulations and generative models
Bayesian methods were historically called the “method of inverse probability”. This is because the way we build Bayesian models by writing down what we expect to observe given some unobserved parameters, and not what unobserved parameters we have given some observation. In other words, we write forward models, that have some assumed underlying mechanics, governed by values we do not know. These are often not particularly realistic ways of representing the way the world works, but useful approximations that can lead to insight. We can run these models forward to produce synthetic observations and update our belief about the unobserved (latent) parameters. This is a generative approach to modelling; we build models that ought to generate what we observe.
Forward and inverse
We can characterise Bayesian approaches as using generative, forward models, from parameters to observations. Approaches common in machine learning, like training a classifier to labels images are inverse models. These map from observations to hidden variables. A Bayesian image modelling approach would map \text{labels} \rightarrow \text{images}; an inverse model would map \text{images} \rightarrow \text{labels}. One major advantage of the generative approach is that it is easy to fuse other sources of information. For example, we might augment a vision system with an audio input. A Bayesian model would now map \text{labels} \rightarrow \text{images, sounds} — two distinct manifestations of some common phenomena, evidence from either being easily combined. An inverse model can be trained to learn \text{sounds} \rightarrow \text{labels} but it is harder to combine this with an existing \text{images} \rightarrow \text{labels} model.
In practice, we usually use a combination of forward models and inverse models to make inference computationally efficient. For example, imagine we are tracking a cursor using an eye tracker. We want to know what on-screen spatial target a user is fixating on, given a camera feed from the eyes. A “pure” Bayesian approach would generate eye images given targets; synthesize actual pixel images of eyes and compare them with observations to update a belief over targets (or be able to compute the likelihood of an image given a parameter setting).
This is theoretically possible but practically difficult, both for computational reasons (images are high dimensional) and because of the need to integrate over a vast range of irrelevant variables (size of the user's pupils, colour of the viscera, etc.). A typical compromise solution would be to use an inverse model, such as traditional signal processing and machine learning, to extract a pupil contour from the image. Then, the Bayesian side could infer a distribution over parameterised contours given a target, and use that to identify targets.
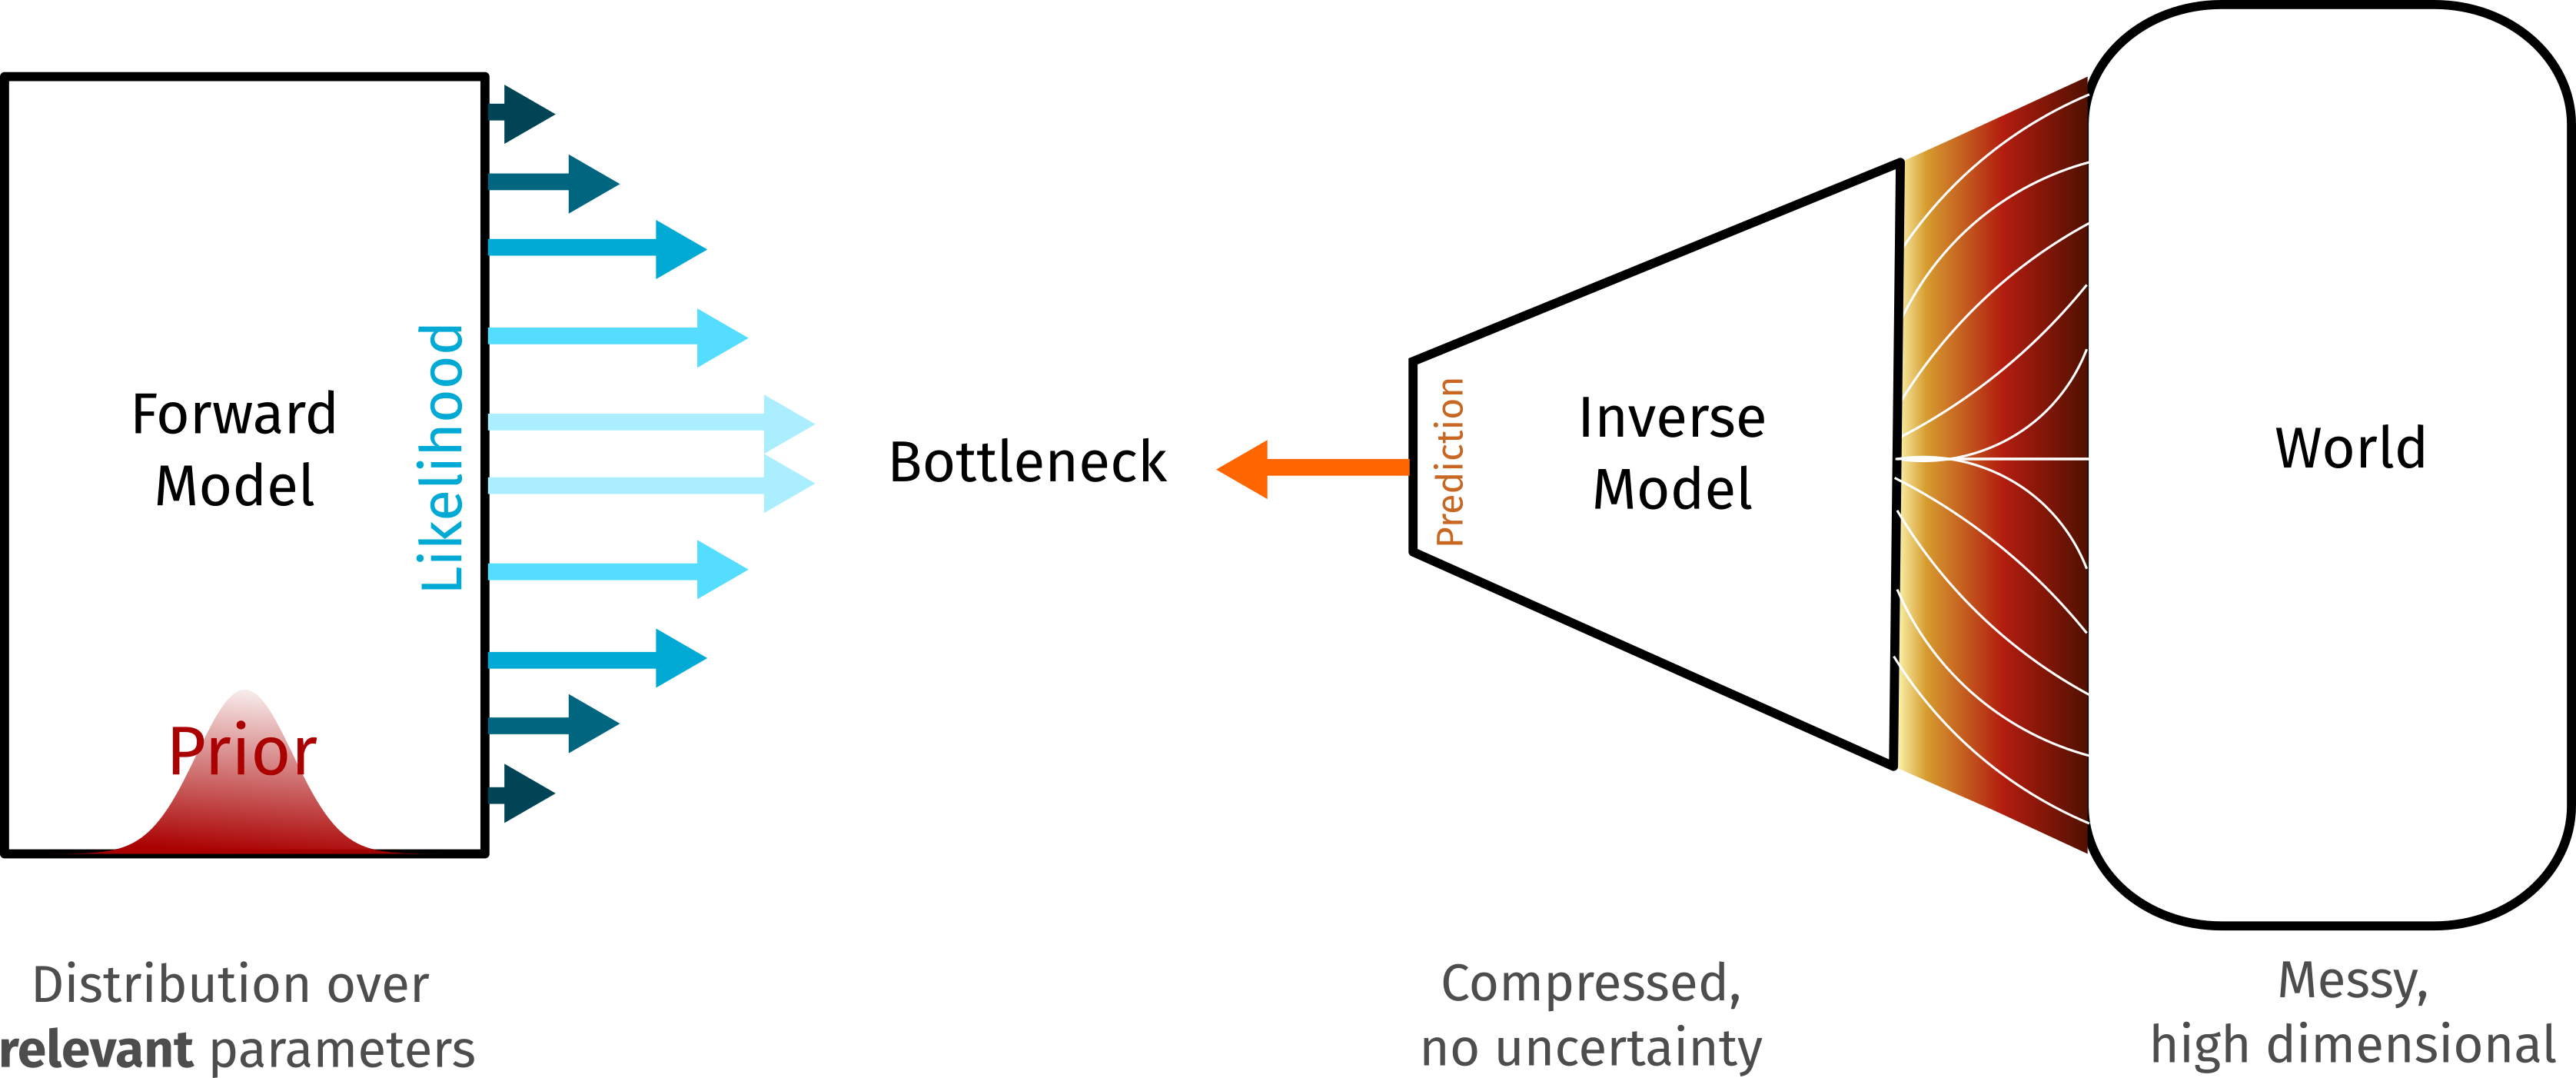
This is a common pattern: the inverse model bottleneck, where some early parts of the model are implemented in forward mode and inferred in a Bayesian fashion; but these are compared against results from an inverse model that has compressed the messy and high-dimensional raw observations into a form where Bayesian inference is practical (Figure 15). Combinations of modern non-Bayesian machine learning methods with Bayesian models can be extremely powerful. A deep network, for example, can be used to compress images into a lower-dimensional space to be fed into a Bayesian model. This can turn theoretically-correct but computational impractical pure Bayesian models into workable solutions.
Decision rules and utilities
Bayesian methods in their narrowest sense are concerned only with updating probabilities of different possible configurations. This, on its own, is insufficient to make decisions. In an HCI context, we often have to make irreversible state changes.
For example, in a probabilistic user interface, at some point, we have to perform actions; that is make a decision about which action to perform. Similar issues come up when deciding whether interface A is more usable than interface B; we might well have both a probability of superiority of A over B, and a value gained by choosing A over B. Whenever we have to go from a distribution to a state change, we need a decision rule, and this usually implies that we also have a utility function U(x) that ascribes values to outcomes.
In a probabilistic user interfaces, we might have just updated the distribution over the possible options based on a voice command, P(\text{option}|\text{voice}) from a speech recogniser. Which option should be actuated? The probabilities don't tell us. We also need a decision rule, which will typically involve attribution of utility (goodness, danger, etc.) to those options.

The decision rule will combine the probability and the utility to identify which (if any) option should be actuated. A simple model is maximum expected utility: choose the action that maximises the average product of the probability and utility. This is rational way to make decisions: choose the decision that is most likely to maximise the “return” (or minimise the “loss”) in the long run. But there are many decision rules that are possible which will be appropriate in different situations, such as:
- The option with the highest posterior probability (sometimes called the maximum a posteriori (MAP) estimate), if no utility function is known or appropriate. However, this ignores the fact that the outcomes might have different values (“reply all” is potentially more destructive than “reply Paul”).
- The option with the highest expected value, which is the product of the probability and the utility. In a probabilistic interface, this automatically makes useful actions easier to select and dangerous ones hard to select; we need to be more certain that an action is intended if it is less desirable.
- The option which minimises regret, which would also capture the lost utility of not selecting particularly valuable actions. This might be particularly relevant in time-constrained interactions, where actions may not be freely available in the future.
Any time we have to take action based on a Bayesian model, we need to define a decision rule to turn probabilities into choices. This almost always requires some form of utility function. Utility functions can be hard to define, and may require careful thought and justification.
What about machine learning? Is it just the same thing?
Modern machine learning uses a wide range of methods, but the dominant approach at the time of writing is distinctly optimisation focused, as opposed to Bayesian. A neural network, for example, is trained by adjusting parameters to find the best parameter setting that minimises a prediction error and so makes the best predictions (or some other loss function). A Bayesian approach to do the same task would find the distribution over parameters (network weights) most compatible with the observations, and not a single best estimate. There are extensive Bayesian machine learning models, from simple Bayesian logistic regression to sophisticated multi-layer Gaussian Processes and Bayesian neural networks, but these are less widespread currently.
Most ML systems also try to map from some observation (like an image of a hand) to a hidden state (which hand pose is this?), learning the inverse problem directly, from outputs to inputs. This can be very powerful and is computationally efficient, but it is hard to fuse with other information. Bayesian models map from hidden states to observations, and adding new “channels” of inputs to fuse together is straightforward; just combine the probability distributions.
Bayesian methods are most obviously applicable when uncertainty is relevant, and where the parameters that are being inferred are interpretable elements of a generative model. Bayesian neural networks, for example, provide some measure of uncertainty, but because the parameters of a neural network are relatively inscrutable, some of the potential benefit of a Bayesian approach is lost. Distributions over parameters are less directly useful in a black box context. All Bayesian machine learning methods retain the advantage of robustness in prediction that comes from representing uncertainty. They are less vulnerable to the specific details of the selection of the optimal parameter setting and may be able to degrade more gracefully when predictions are required from inputs far from the training data.
Bayesian machine learning methods have sometimes been seen as more computationally demanding, though this is perhaps less relevant in the era of billion parameter deep learning models. The ideal Bayesian method integrates over all possibilities, and so the problem complexity grows exponentially with dimension unless clever shortcuts can be used. Machine learning approaches like deep networks rely on (automatic) differentiation rather than exhaustive integration, and more easily scale to large numbers of parameters. This is why we see deep networks with a billion parameters, but rarely Bayesian models with more than tens of thousands of parameters. However, many human computer interaction problems only have a handful of parameters, and are much more constrained by limited data than the flexibility of modelling. Bayesian methods are powerful in this domain.
Prediction and explanation
Much of machine learning is focused on solving the prediction problem, learning to make predictions from data. Bayesian methods address predictions, but can be especially powerful in solving the explanation problem; identifying what is generating or causing some observations. In an interaction context, perhaps we wish to predict the reading speed of a user looking at tweets as a function of the font size used; we could build a Bayesian model to do this. But we might alternatively wish to determine which changes in font size and changes in typeface choice (e.g. serif and sans-serif) might best explain changes in reading speed observed from a large in-the-wild study. Modelling uncertainty in this task is critical, as is the ability to incorporate established models of written language comprehension. This is something Bayesian methods excel at.
How would I do these computations?
We have so far spoken in very high-level terms about Bayesian models. How are these executed in practice? This is typically via some form of approximation (Figure 16).
Exact methods
In some very special cases, we can directly compute posterior distributions in closed form. This typically restricts us to represent our models with a very specific distribution types. Much of traditional Bayesian statistics is concerned with these methods, but except for the few cases where they can be exceptionally computationally efficient, they are too limiting for most interaction problems.
An exact example: beta-binomial models
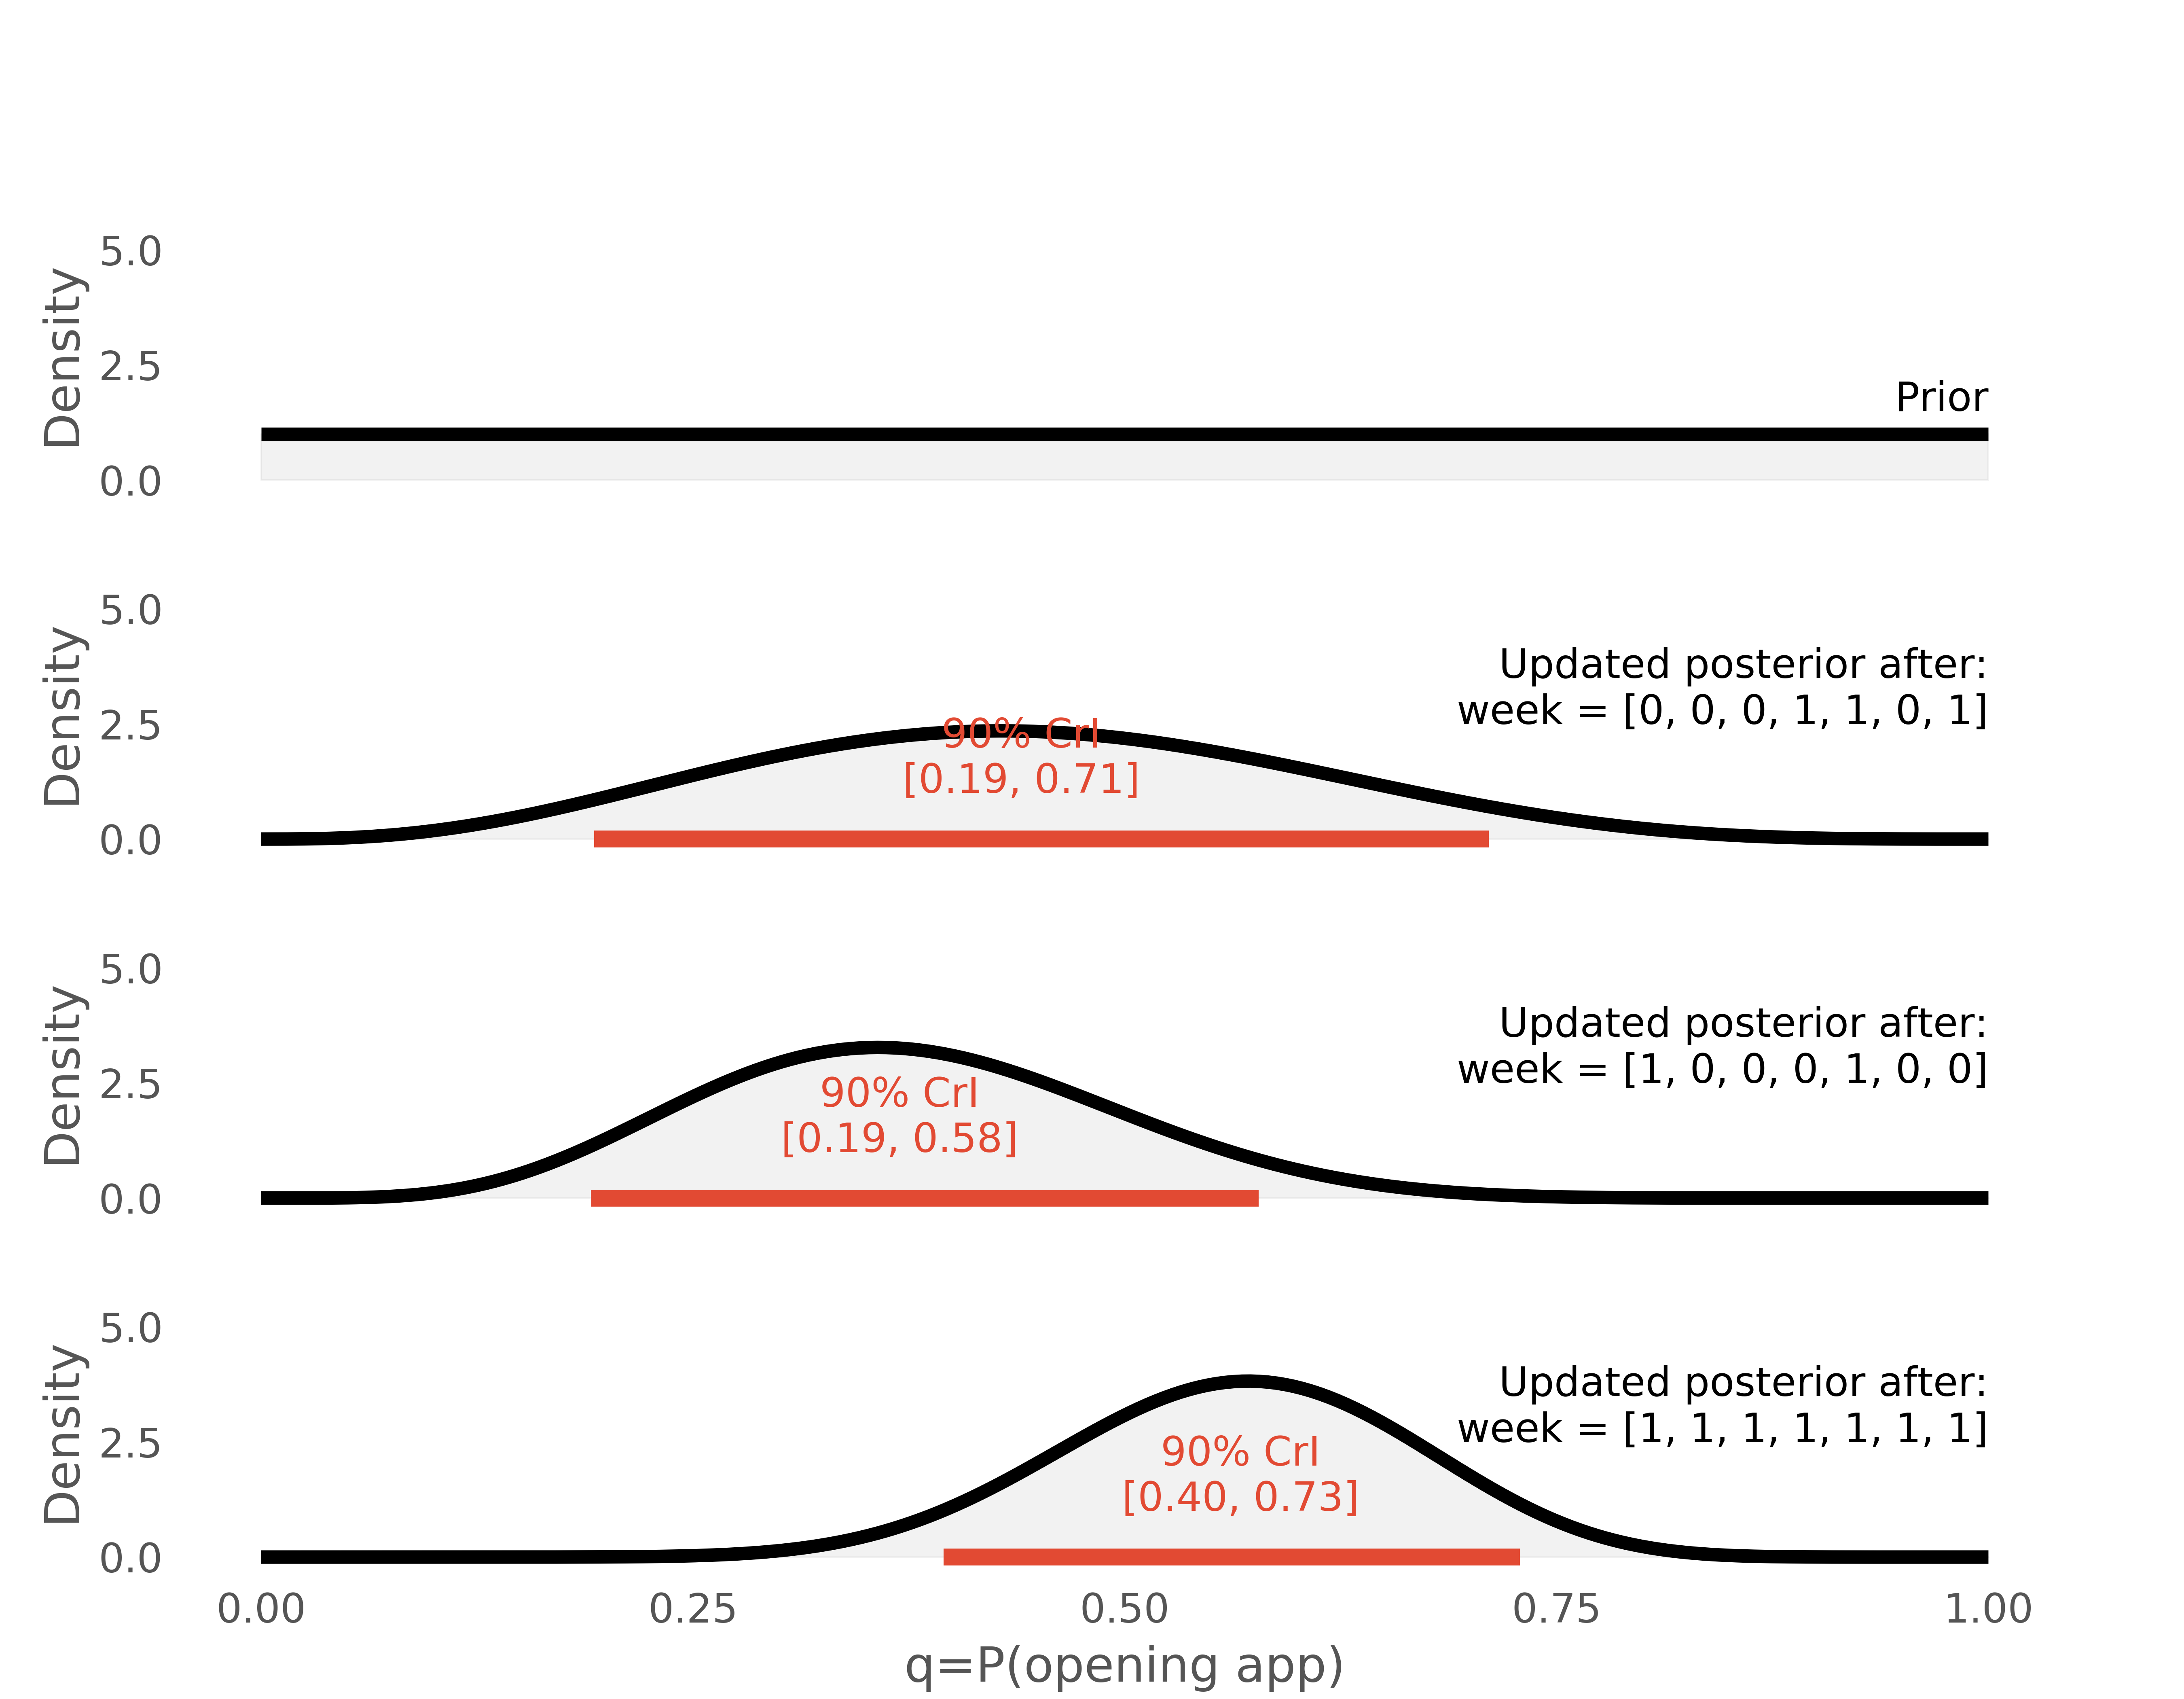
A classic example where exact inference is possible is a beta-binomial model, where we observe counts of binary outcomes (0 or 1) and want to estimate the distribution of the parameter that biases the outcomes to be 0s rather than 1s. If we assume that we can represent the distribution over this parameter using a beta distribution (a fairly flexible way of representing distributions over values bounded in the range [0,1]), then we can write a prior as beta distribution, observe some 0s and 1s, and write a new posterior beta distribution down exactly, following some simple computations.
For example, we might model whether or not a user opens an app on their phone each morning. What can we say about the distribution of the tendency to open the app? It, for example, is not reasonable belief that a user will never open an app if they don't open it the first day, so we need a prior to regularise our computations. We can then make observations and compute posteriors exactly, as long as we are happy that a beta distribution is flexible enough to capture our belief. Because Bayesian updating just moves from one distribution to another, we can update these distributions in any order, in batches or singly, assuming that the observations are independent of each other.
Monte Carlo approximation
The most promising and most general approach to Bayesian inference is sample based approaches, that sidestep manipulation of distributions by approximating them as collections of samples. To perform computations, we draw random samples from distributions, apply operations to the samples and then re-estimate statistics we are interested in. In Bayesian applications, we draw random samples from the posterior distribution to perform inference. This makes operations computationally trivial. Instead of working with tricky analytical solutions, we can select, summarise or transform samples just as we would ordinary tables of data. These methods normally operate by randomly sampling realisations from a distribution and are known as Monte Carlo approximations.
Markov chain Monte Carlo (MCMC) is a specific class of algorithms which can be used to obtain Monte Carlo approximations to distributions from which it is hard to sample. In particular, MCMC makes it easy to sample from the product of a prior and likelihood, and thus draw samples from the posterior distribution. MCMC sets up a “process” that walks through the space of the distribution, making local steps to find new samples. There are lots of ways of implementing this, but under relatively weak assumptions this can be shown to eventually draw samples from any posterior.
MCMC is very powerful and general, but there a number of MCMC algorithms available and each has its own parameters to tweak that affect the inference results. This is undesirable: our posterior distributions should depend only on the prior and the evidence we have, not on settings like the “step size” in an MCMC algorithm. In practice, MCMC is often a bit like running a hot rod car: there's a lot of tuning to get smooth performance and if you don't know what you are doing it might blow up. There is an art to tuning a MCMC algorithm to make them tick over smoothly, and many diagnostics to verify that the sampling process is behaving itself.
Monte Carlo approaches generate samples from posterior distributions, but we often want to represent and report results in terms of distributions. This requires a conversion step back from samples into summaries of the approximated distributions. Common approaches to do this include histograms or kernel density estimates (e.g. for visualisation). Alternatively summary statistics, like means, medians or credible intervals can be computed directly from the samples themselves. All MCMC methods have approximation error. This error reduces as the number of samples increases, but slowly (the Monte Carlo error decreases as O(\sqrt{N}), assuming the sampling is working correctly).
Variational approximation
Variational methods approximate posteriors with distributions of a simple, constrained form which are easy to manipulate. The approximating distributions are optimised to best fit the posterior. One common approach, for example, is to represent the posterior with a normal distribution, which can be completely represented by a mean vector (location) and covariance matrix (scale/spread).
Variational approximations have benefits and drawbacks:
- They are typically extremely efficient. When they are applicable they can be orders-of-magnitude faster than Monte Carlo approximations for the same level of accuracy.
- They often have relatively few parameters of their own to tweak, so less tuning and tweaking is required to get good results than is common in Monte Carlo approaches.
- They are relatively rigid in the posterior forms that can be represented. This depends on the approximation used, but, for example, a variational approximation with a normal distribution cannot represent multiple modes (peaks in the probability density), which may be important.
- Variational methods typically need to be specifically derived for a particular class of models. Most variational methods cannot simply be slotted into a probabilistic program and instead need expert skills to construct.
Some modern methods, like automatic differentiation variational inference (ADVI) can be used without custom derivations, and can be plugged into virtually any Bayesian inference models with continuous parameters. ADVI can be used in a wide range of modelling problems, but has a limited ability to represent complex posteriors.
In interaction problems, variational methods are an excellent choice if an existing variational method is a good fit to the problem at hand and the form of posterior expected is compatible with the approximating distribution. They can be particularly valuable when low-latency response is required, for example when embedded in the interaction loop.
Probabilistic programming
A rapidly developing field for Bayesian inference is probabilistic programming, where we write down probabilistic models in an augmented programming language. This transforms modelling from a mysterious art of statisticians to an ordinary programming problem. In probabilistic programming languages, random variables are first class values that represent distributions rather than definite values. We can set priors for these variables and then “expose” the program to observed data to infer distributions over variables. Inference becomes a matter of selecting an algorithm to run. This is often a MCMC based approach (e.g. in Stan [carpenter_stan_2017]), but other tools allow variational methods to be plugged in as well (as in pymc3 [salvatier_probabilistic_2016]). Probabilistic programs can encode complex simulators, and are easy and familiar for computer scientists to use. Probabilistic programming languages still need tuning and diagnostics of their underlying inference engines, but otherwise are plug-and-play inference machines. As an example, the pymc3 code below implements the model of reading time as a linear relationship.
with pm.Model():
    # prior on slopes;
    # probably around 0, not much more
    # than 10-20 in magnitude
    b1 = pm.Normal(0, 10)

    # prior on constant reading time;
    # positive and probably
    # less than 30-60 seconds
    b0 = pm.HalfNormal(30.0)

    # prior on measurement noise;
    # positive and not likely to
    # be much more than 10-20
    measurement_noise = pm.HalfNormal(10.0)

    # font_size is observed.
    # We set ba uniform prior here to
    # allow simulation without data
    font_size = pm.Uniform("font_size", 2,
                            32, observed=font_size)

    # estimated average reading
    # time is a linear function
    mean_read_time = b1 * font_size + b0

    # and the reading time is observed
    read_time = pm.Normal("read_time",
                            mu=mean_read_time,
                            sigma=measurement_noise,
                            observed=read_time)
This code implements the simple linear reading time example as a probabilistic program in pymc3.
Observing a table of pairs of the observed variables read_time and font_size would let us infer distributions over b0 and b1 and measurement_noise — more precisely, an MCMC sampler would draw a sequence of random samples approximately from the posterior distribution, and return a table of posterior parameter distributions. This sample sequence from an MCMC process is known as a trace. Traces can be visualised directly or represented via summary statistics.
Can you give me an example?
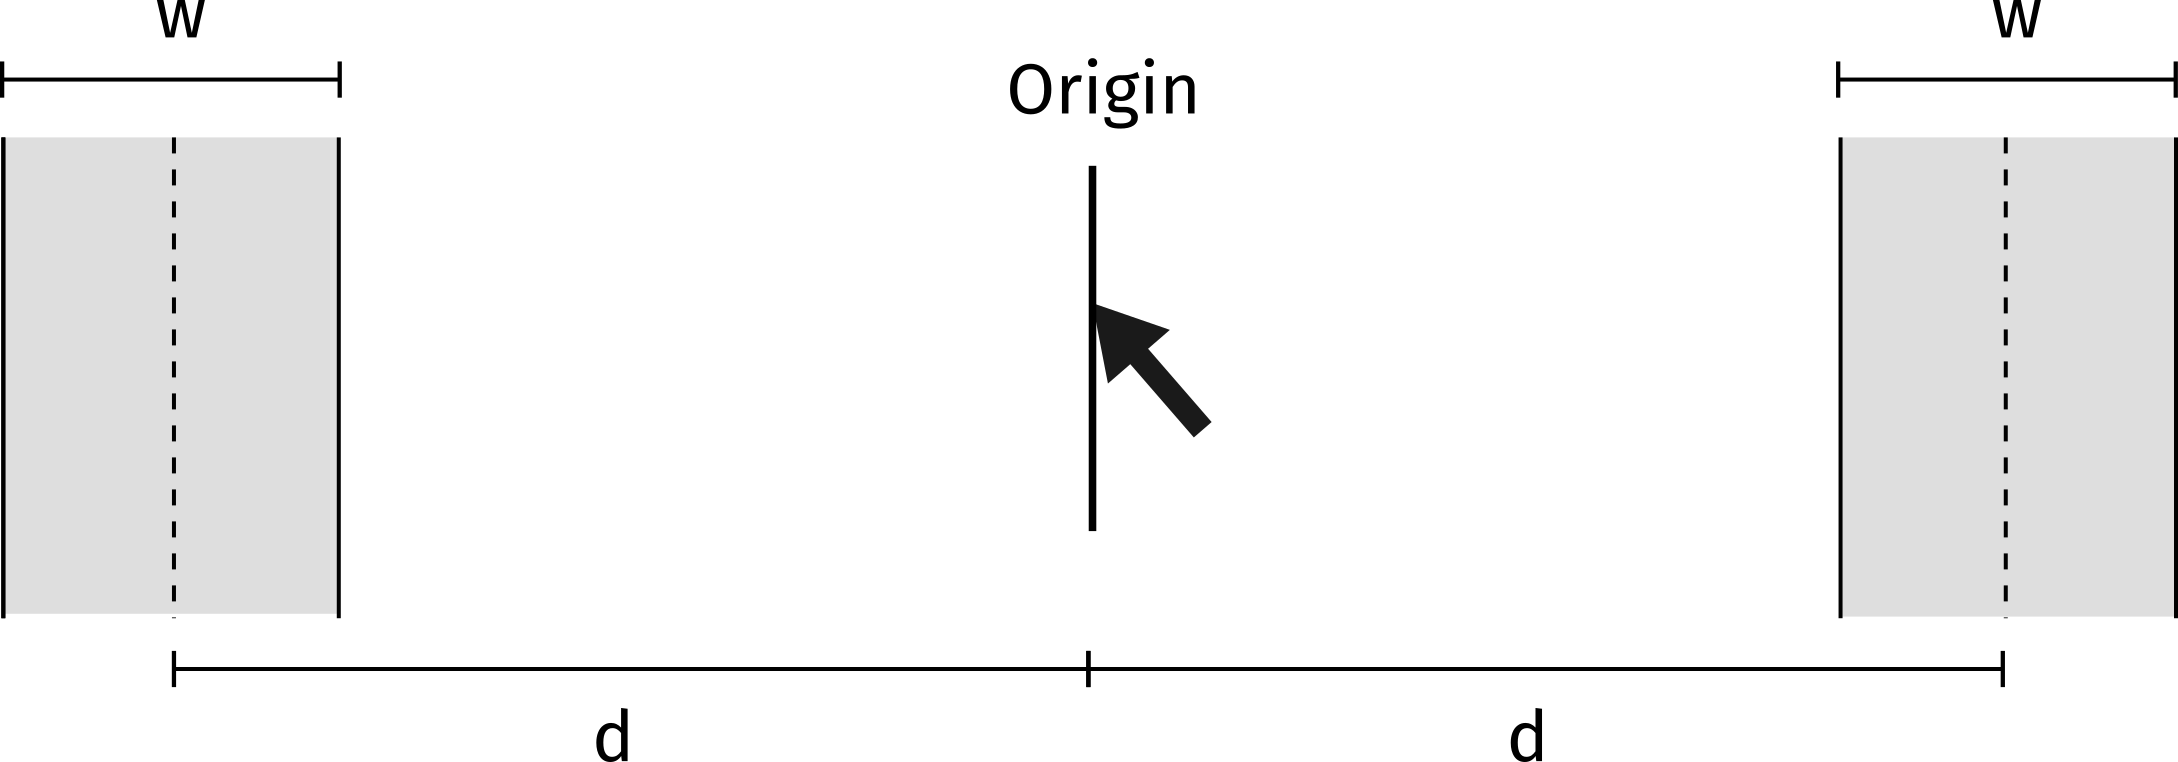
Let's work through a worked example of Bayesian analysis. We'll examine a problem familiar to many interaction designers: Fitts' law [fitts_information_1954]. This “law” is an approximate model of pointing behaviour, that predicts time to acquire a target as a function of how wide a target is and how far away it is (Figure ?). It is a well-established model in the HCI literature [mackenzie_fitts_1992-1].
Model
The Fitts' law model is often stated in the form:
MT = a + b \log_2\left(\frac{d}{w}+1\right)
This tells us that we predict the movement time (MT) to acquire a target will be determined by the logarithm of the ratio of the target distance d and target size w. This is a crude but surprisingly robust predictive model. The two parameters a and b are constants that vary according to the input device used. In statistical terminology, this is a “generalised linear model with a log link function”. It can be easier to see the linear nature of the model by writing ID=\log_2(\frac{d}{w}+1) and the model is then just MT = a + b ID — i.e. a straight line relationship between MT and ID defined by a, b. The term ID is often given in units of bits; the justification for doing so comes from information theory. A higher ID indicates a larger space of distinguishable targets, and thus more information communicated by a pointing action.
How might we approach modelling a new pointing device in a Bayesian manner? Let's assume we run an experiment with various settings of ID (by asking users to select targets with some preset distances and sizes). This fixes ID; it is an independent variable. We measure MT, the dependent variable. We are therefore interested in modelling the latent parameters a and b, which we cannot observe directly. We know that our measurements are noisy. Running the same trial with the same ID will not give the exact same MT. So we must model the expected noise, which we will notate as \epsilon. Perhaps we expect it to be normally distributed, and we can write our model down:
MT = a + b ID + \epsilon MT = a + b ID + \mathcal{N}(0, \sigma^2),
We don't know what \sigma is, so it becomes another latent parameter to infer. Unlike in, say, least square regression, we don't have to assume that our noise is normally distributed, but it is a reasonable and simple assumption for this problem. See Normal Distributions in the Appendix for a justification.
In code, our generative model is something like:
class FittsSimulator:

    def __init__(self, a, b):
        self.a, self.b = a, b


    def simulate(self, n, d, w):
        # compute ID
        ID = np.log2(d / w + 1)

        # generate random samples
        mu = a + b * ID
        return scipy.stats.norm(mu, sigma).rvs(n)

    def log_likelihood(self, ds, ws, mts):
        # compute IDs
        IDs = np.log2(ds / ws + 1)
        mu = a + b * IDs

        # compute how likely these movement times
        # given a collection of matching d, w pairs
        return np.sum(scipy.stats.norm(mu, sigma).logpdf(mts))
Priors
To do Bayesian inference, we must set priors on our latent parameters. These represent what we believe about the world. Let's measure MT in seconds, and ID in bits to give us units to work with. Now we can assume some priors on a, b and \sigma. Reviewing our variables:
- MT is the dependent variable, and is observed
- ID is the independent variable, and is also observed
- a is the “offset” and is unobserved. We might assume it has a normal prior distribution, perhaps mean 0, std. dev. 1
- b is the “slope” and is unobserved. We might again assume a normal prior distribution, perhaps mean 0, std. dev. 2
- \sigma is the noise level and is also unobserved. Here, we need a positive value. We might choose a “half-normal” with std. dev. 1
These priors are weakly informative. These are our conservative rough guesses as plausible values (is it likely that we have a 3 second constant offset a?; no, but it's not impossible). There is nothing special about this choice of normal distributions. It is simply a convenient way to encode our rough initial belief.
- Q: Did we not just choose the answer? Couldn't we set the prior to whatever we want to get the answer we want to see?
- A: No, we did not, and this argument is ill-founded. We could write down a prior that specified the answer. For example, we could set a prior that puts all probability density on the possibility b=0.0. This is possible, but obviously the evidence will never change this belief. It is equivalent to logical reasoning that started with the axiom “all apples are red”, then followed a process of reasoning. The final result would be “apples are red”, because we assumed that to start the reasoning process! Likewise, a prior, specifies our assumptions explicitly. This is both a reasonable thing to do, and a valuable one — it requires us to be explicit in stating our assumptions, and in a form that we can then test and inspect, with ideas like prior predictive checks.
Prior predictive checks
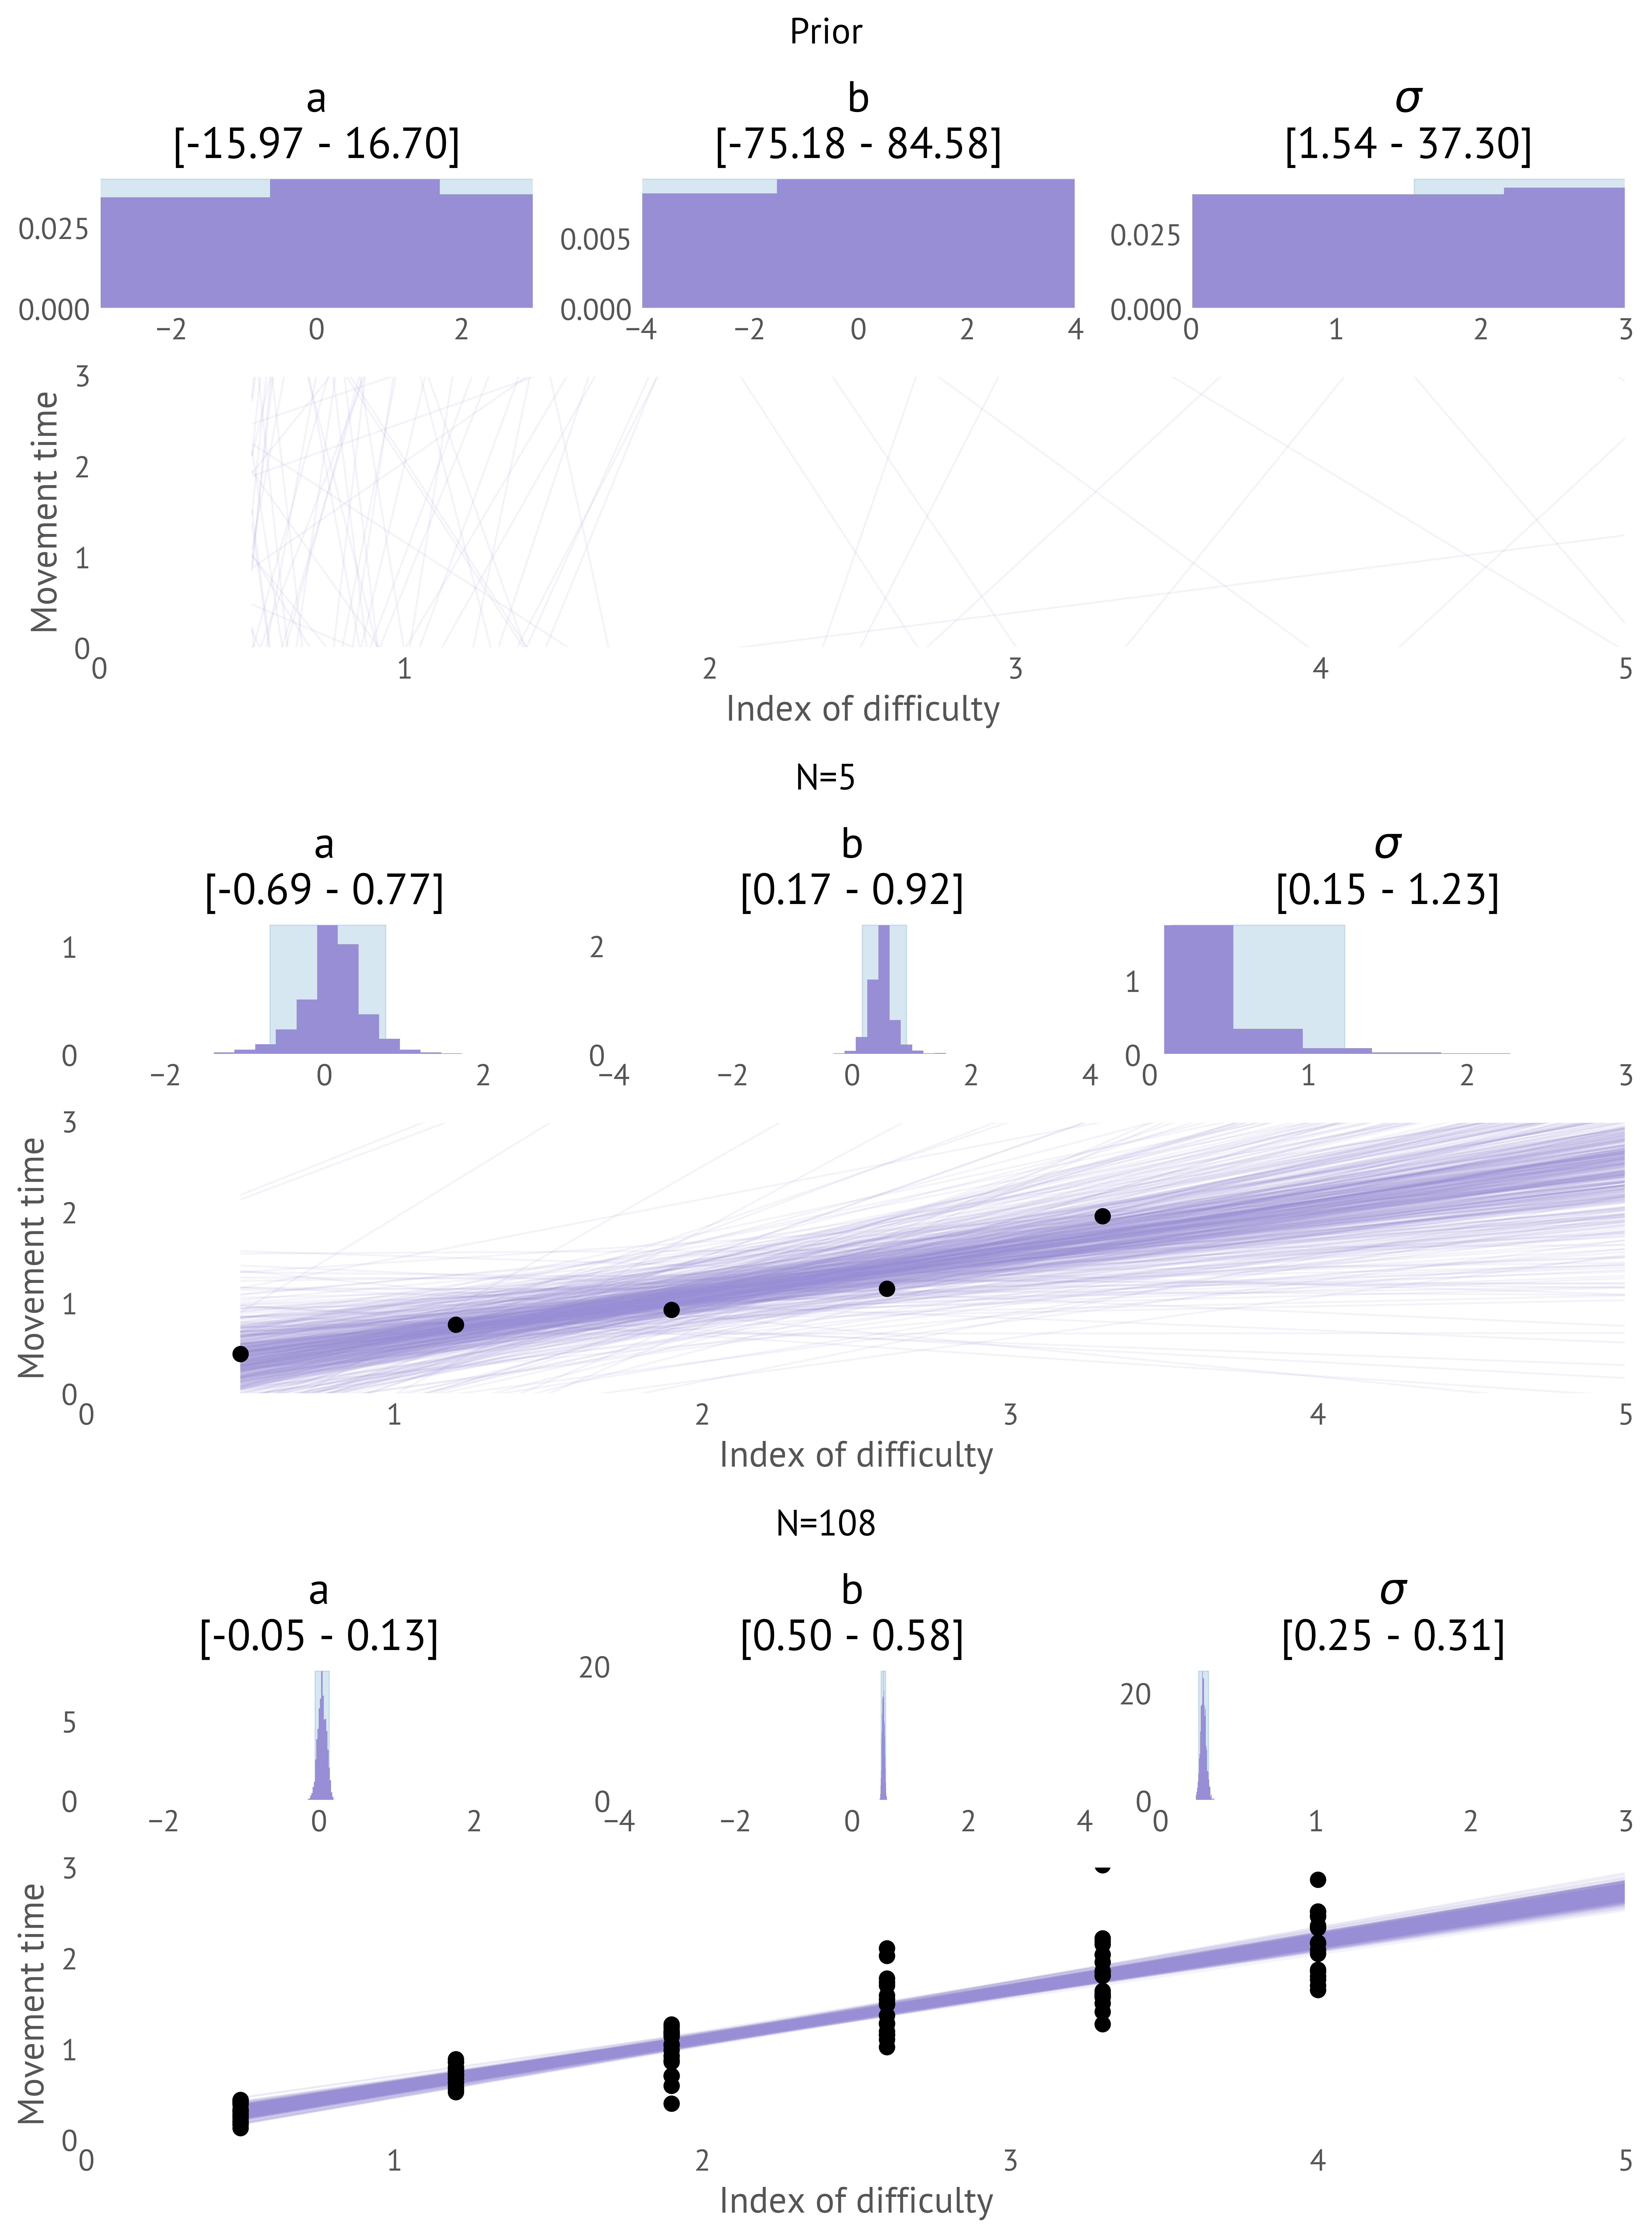
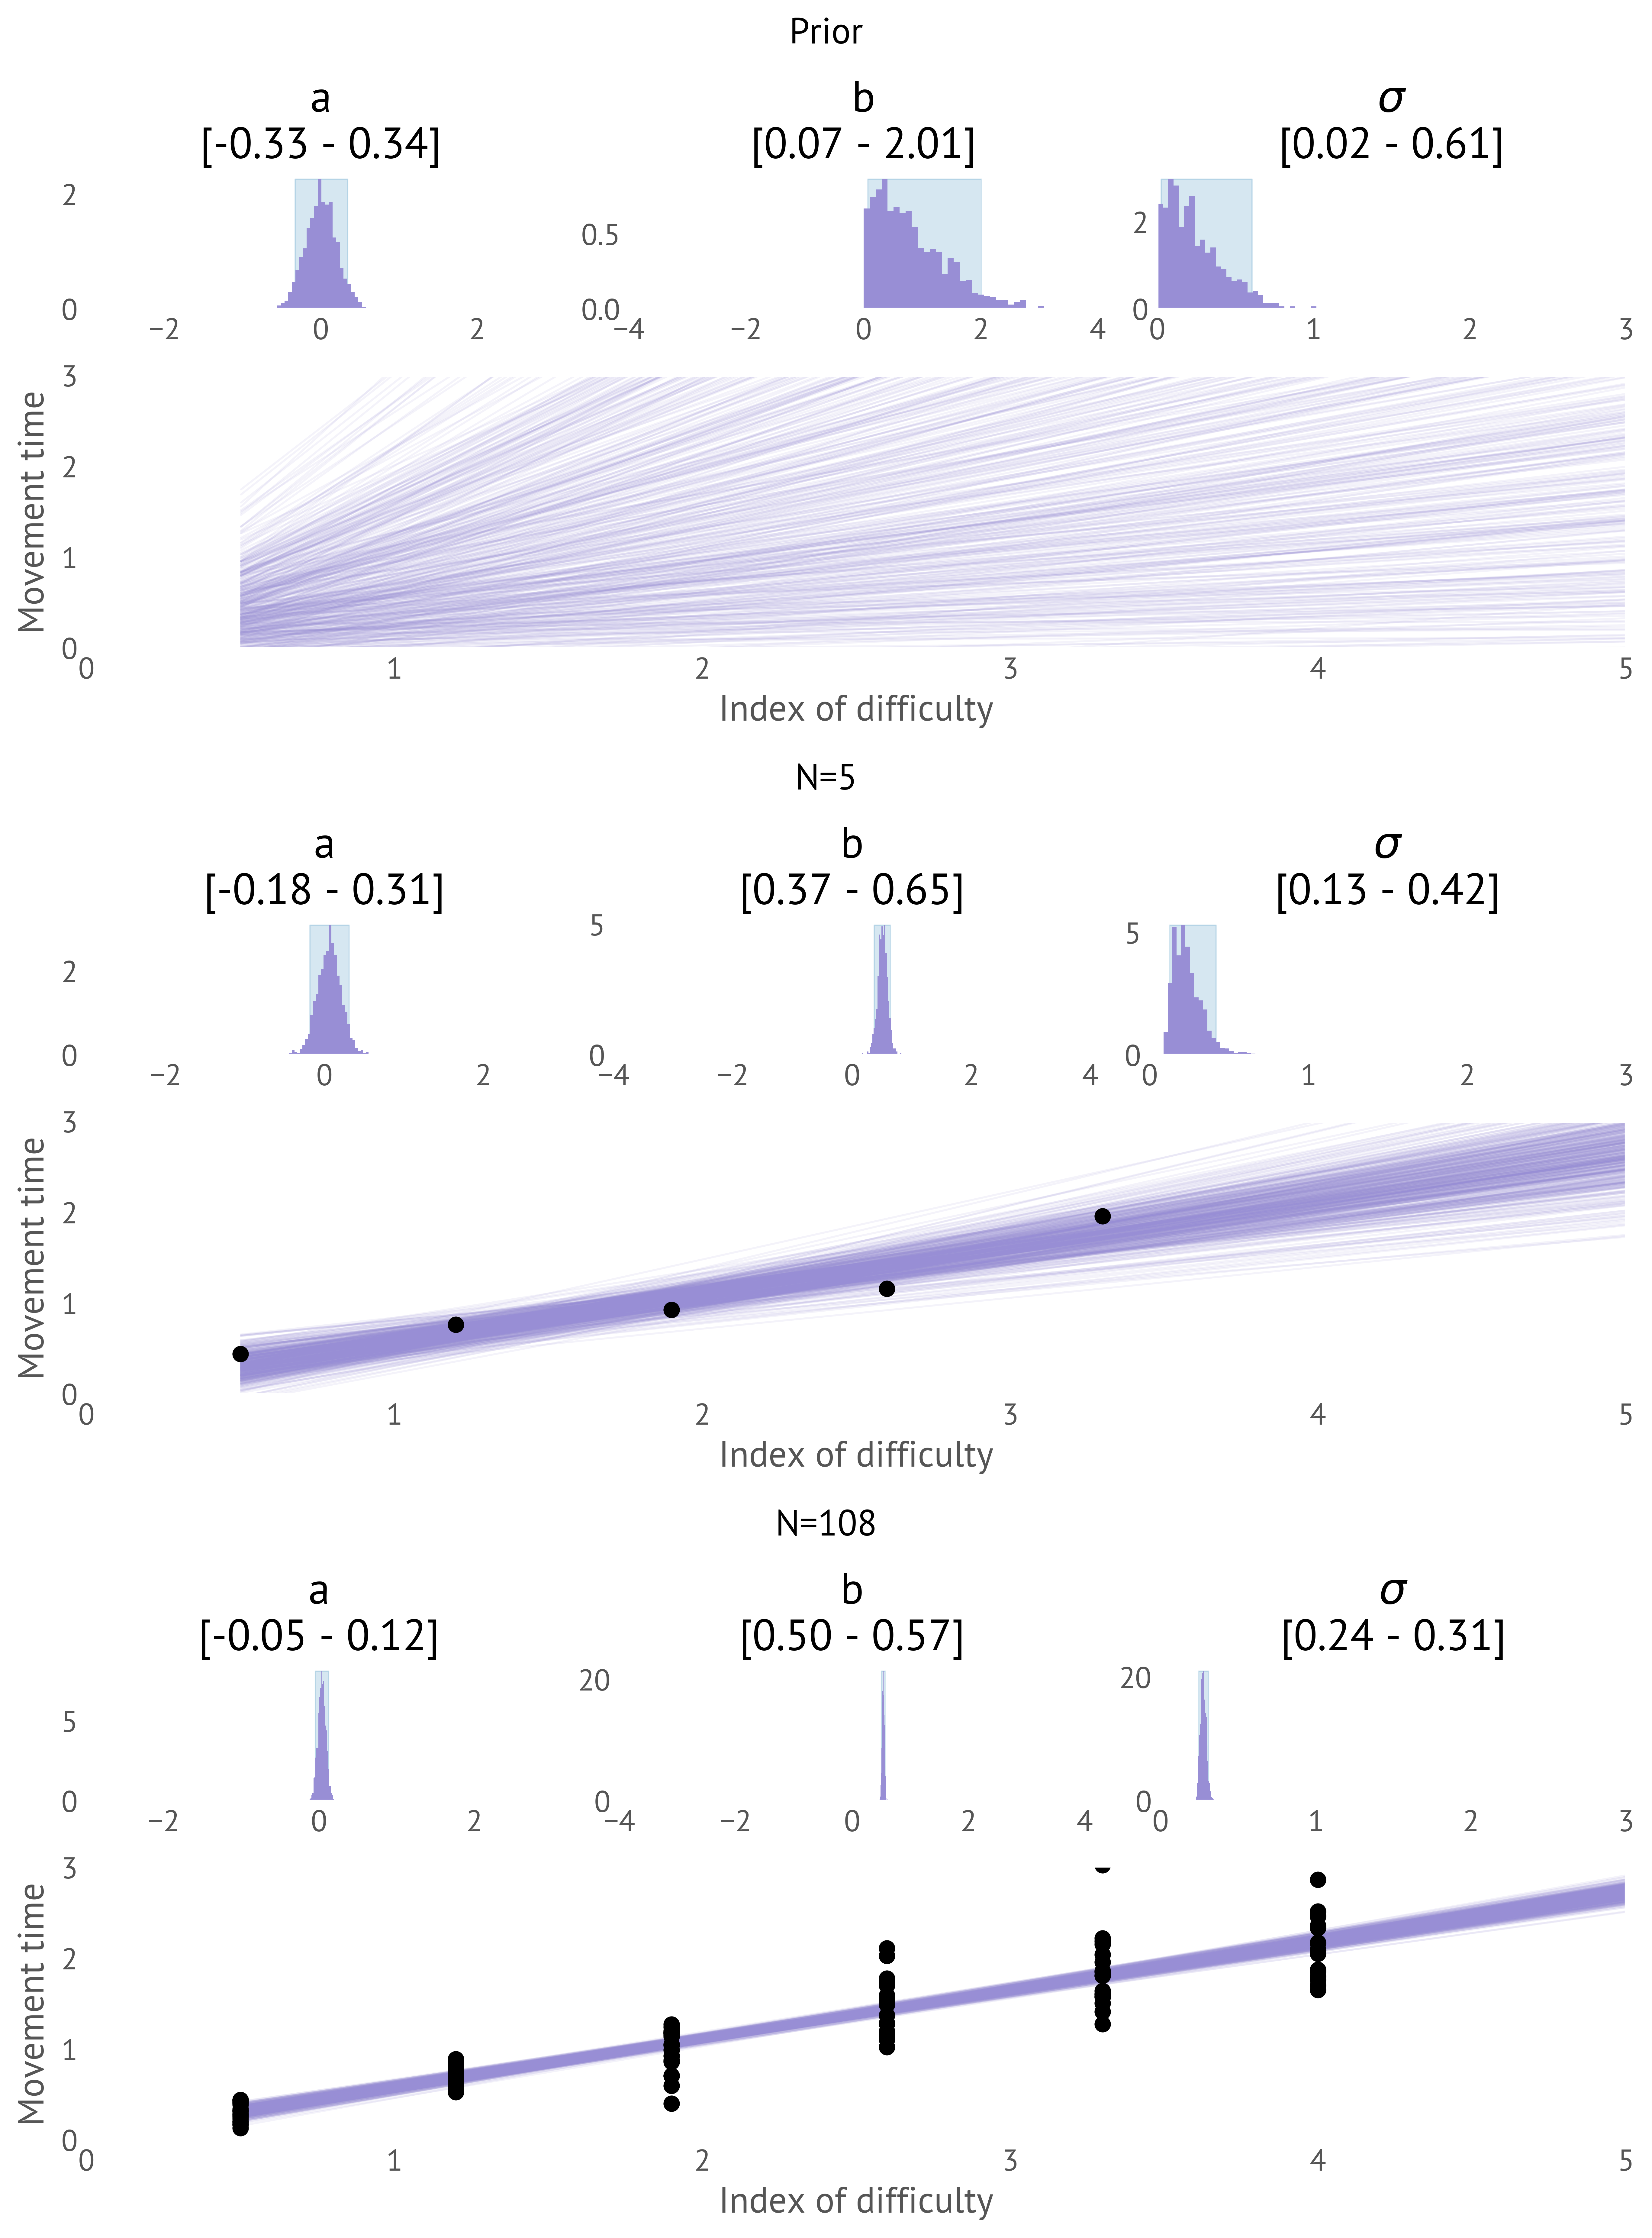
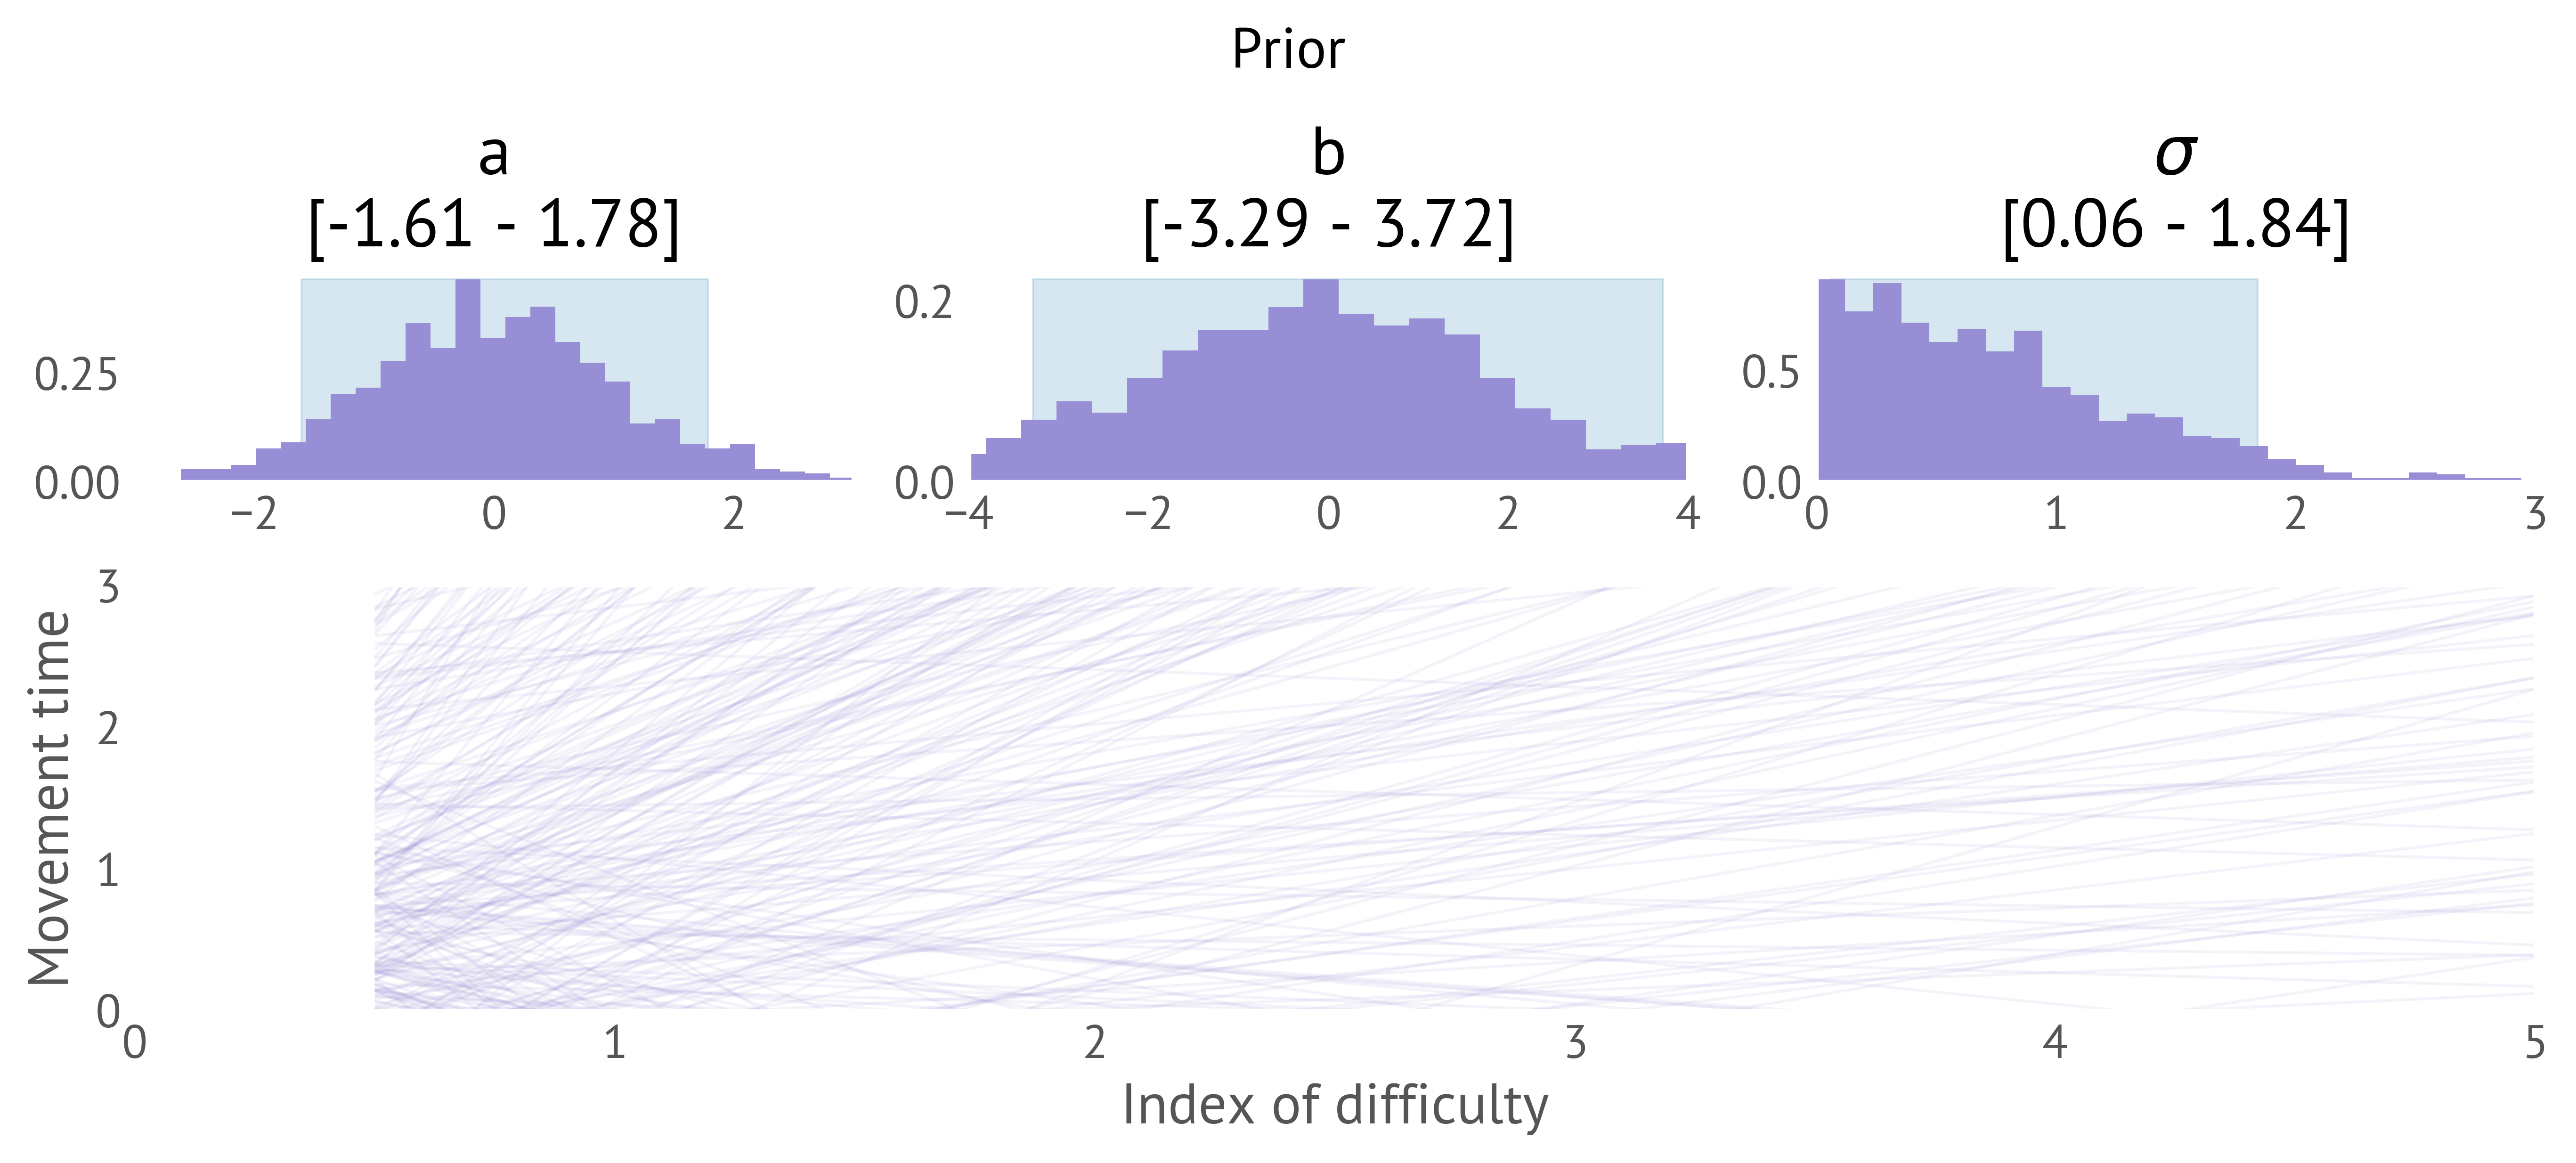
What do these priors imply? One major advantage of a Bayesian model is that we can draw samples from the prior and see if they look plausible. It's most useful to see these as the lines MT, ID space that a, b imply, even though we are sampling from a,b,\sigma. Transforming from the prior distribution over parameters to the observed variables gives us prior predictive samples. We can see that the prior chosen can represent many lines, a much more diverse set than we are likely to encounter (Figure 18), and can conclude that our priors are not unreasonably restrictive. Here we are just eyeballing the visualisations as a basic check; in other situations we might compute summary statistics and validate them numerically (e.g. testing that known positive values are positive in the prior predictive).
Inference
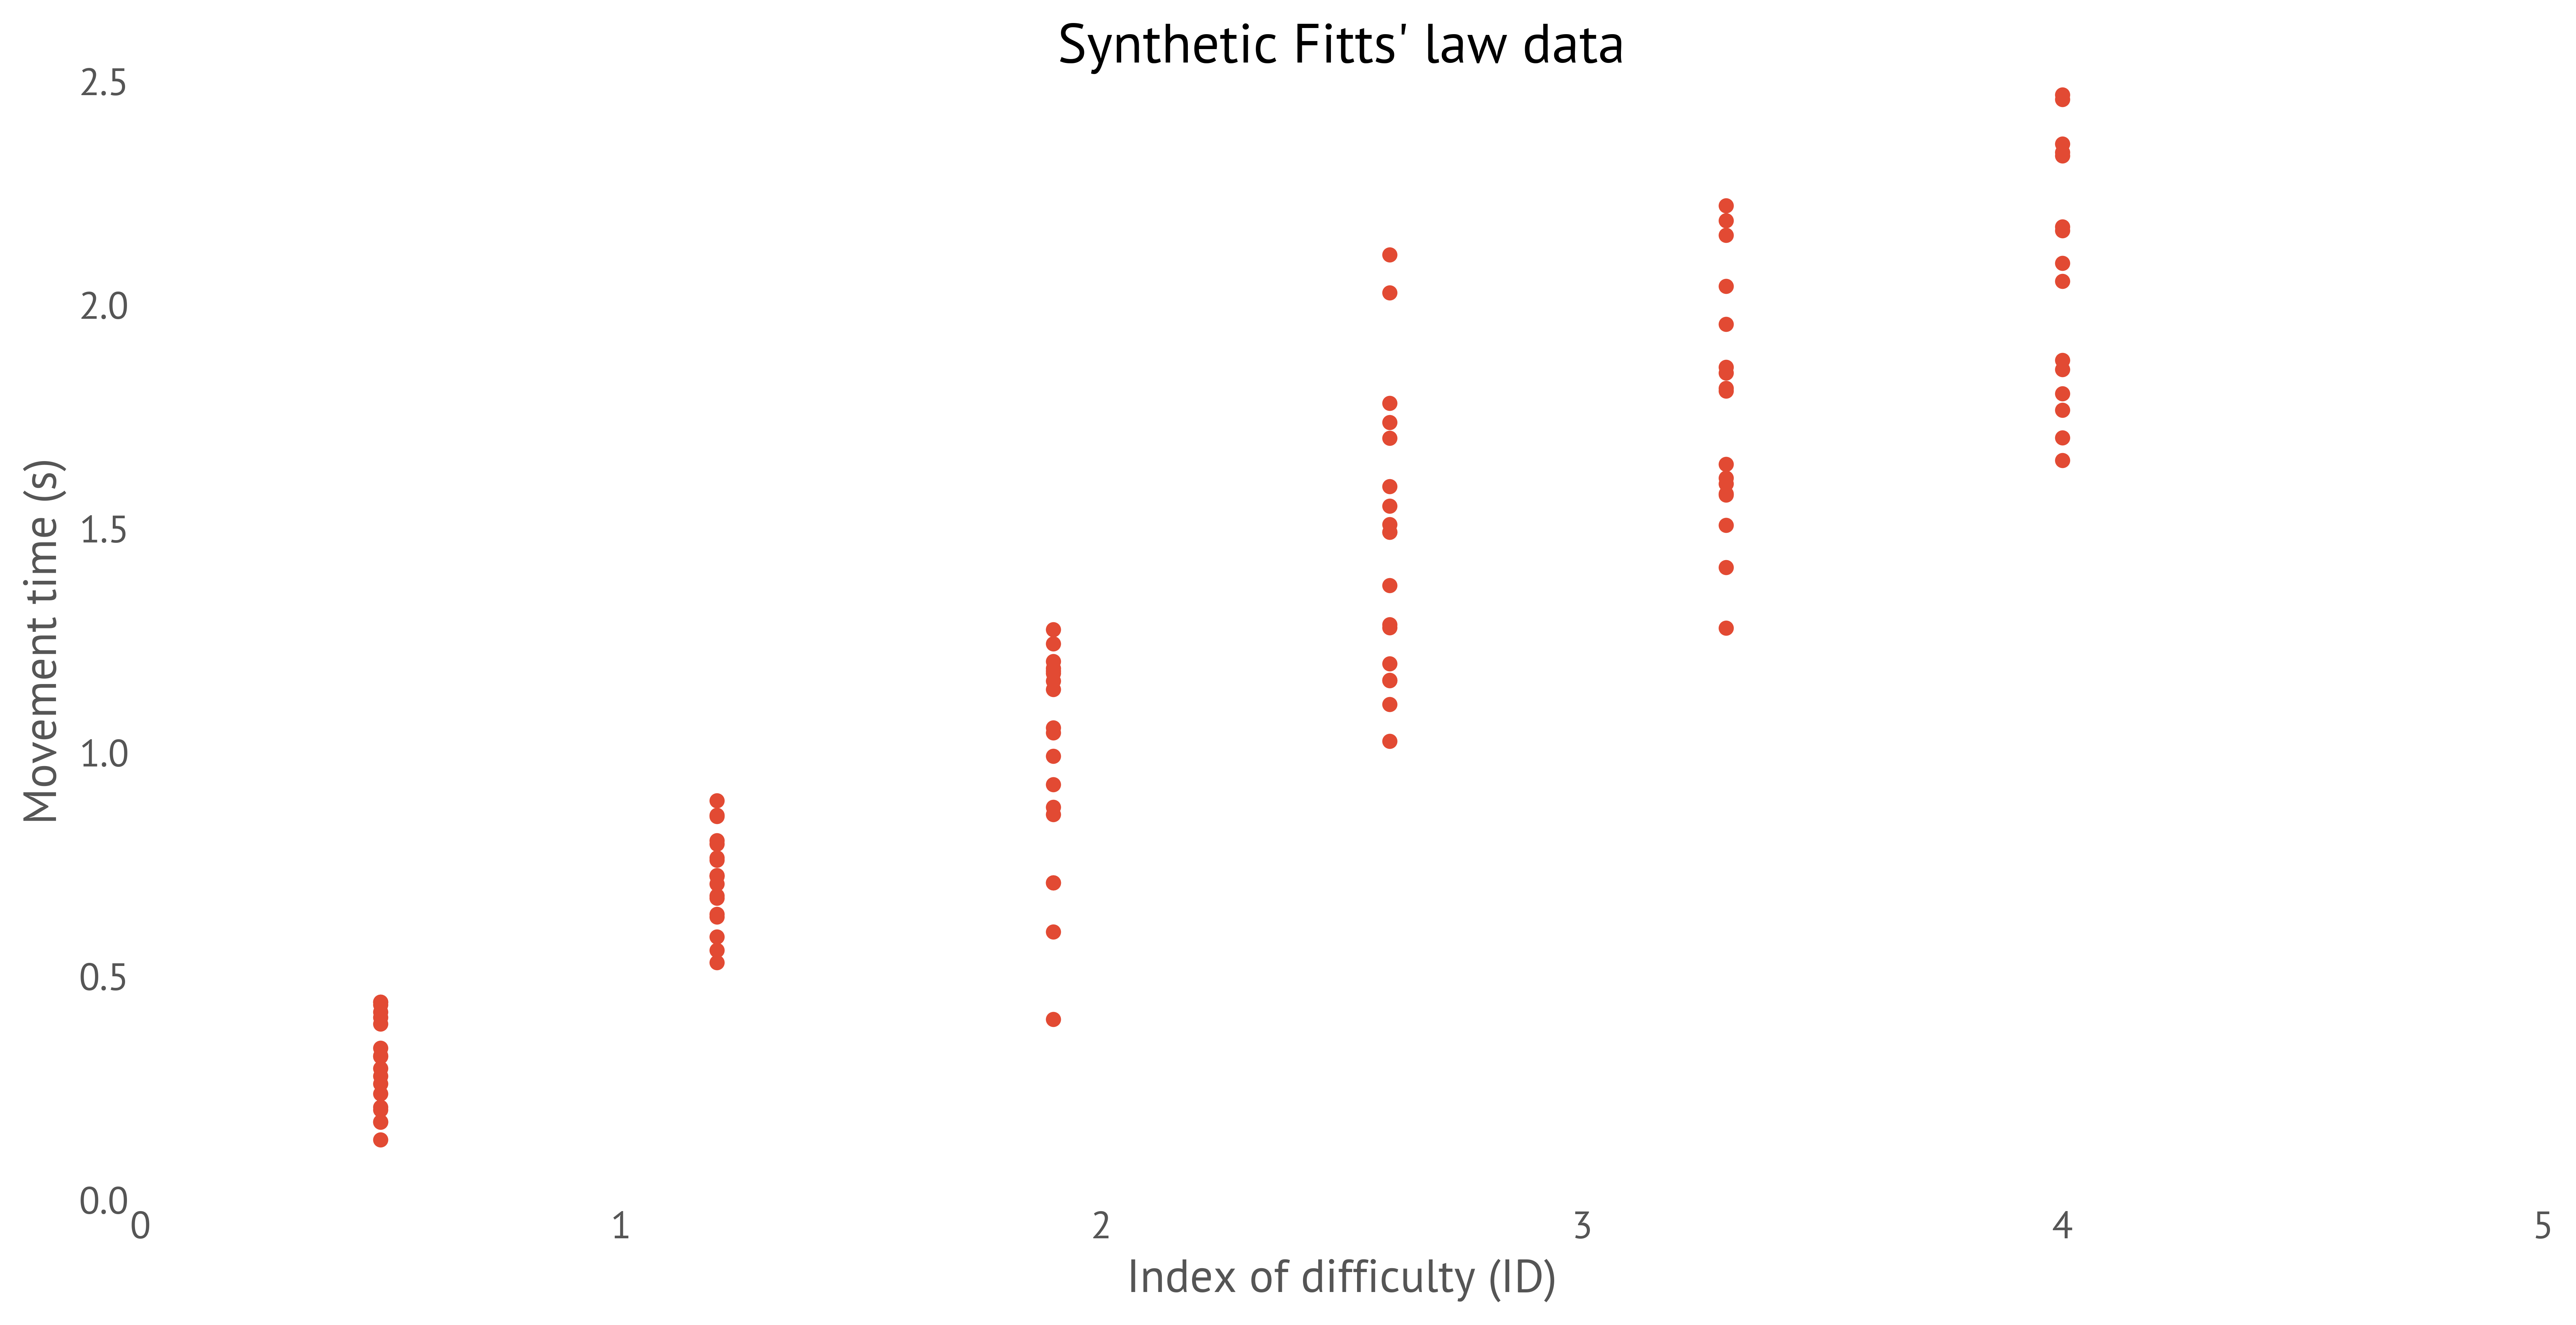
Now imagine we run a pointing experiment with users and capture MT, ID pairs and that are plotted in Figure 19.
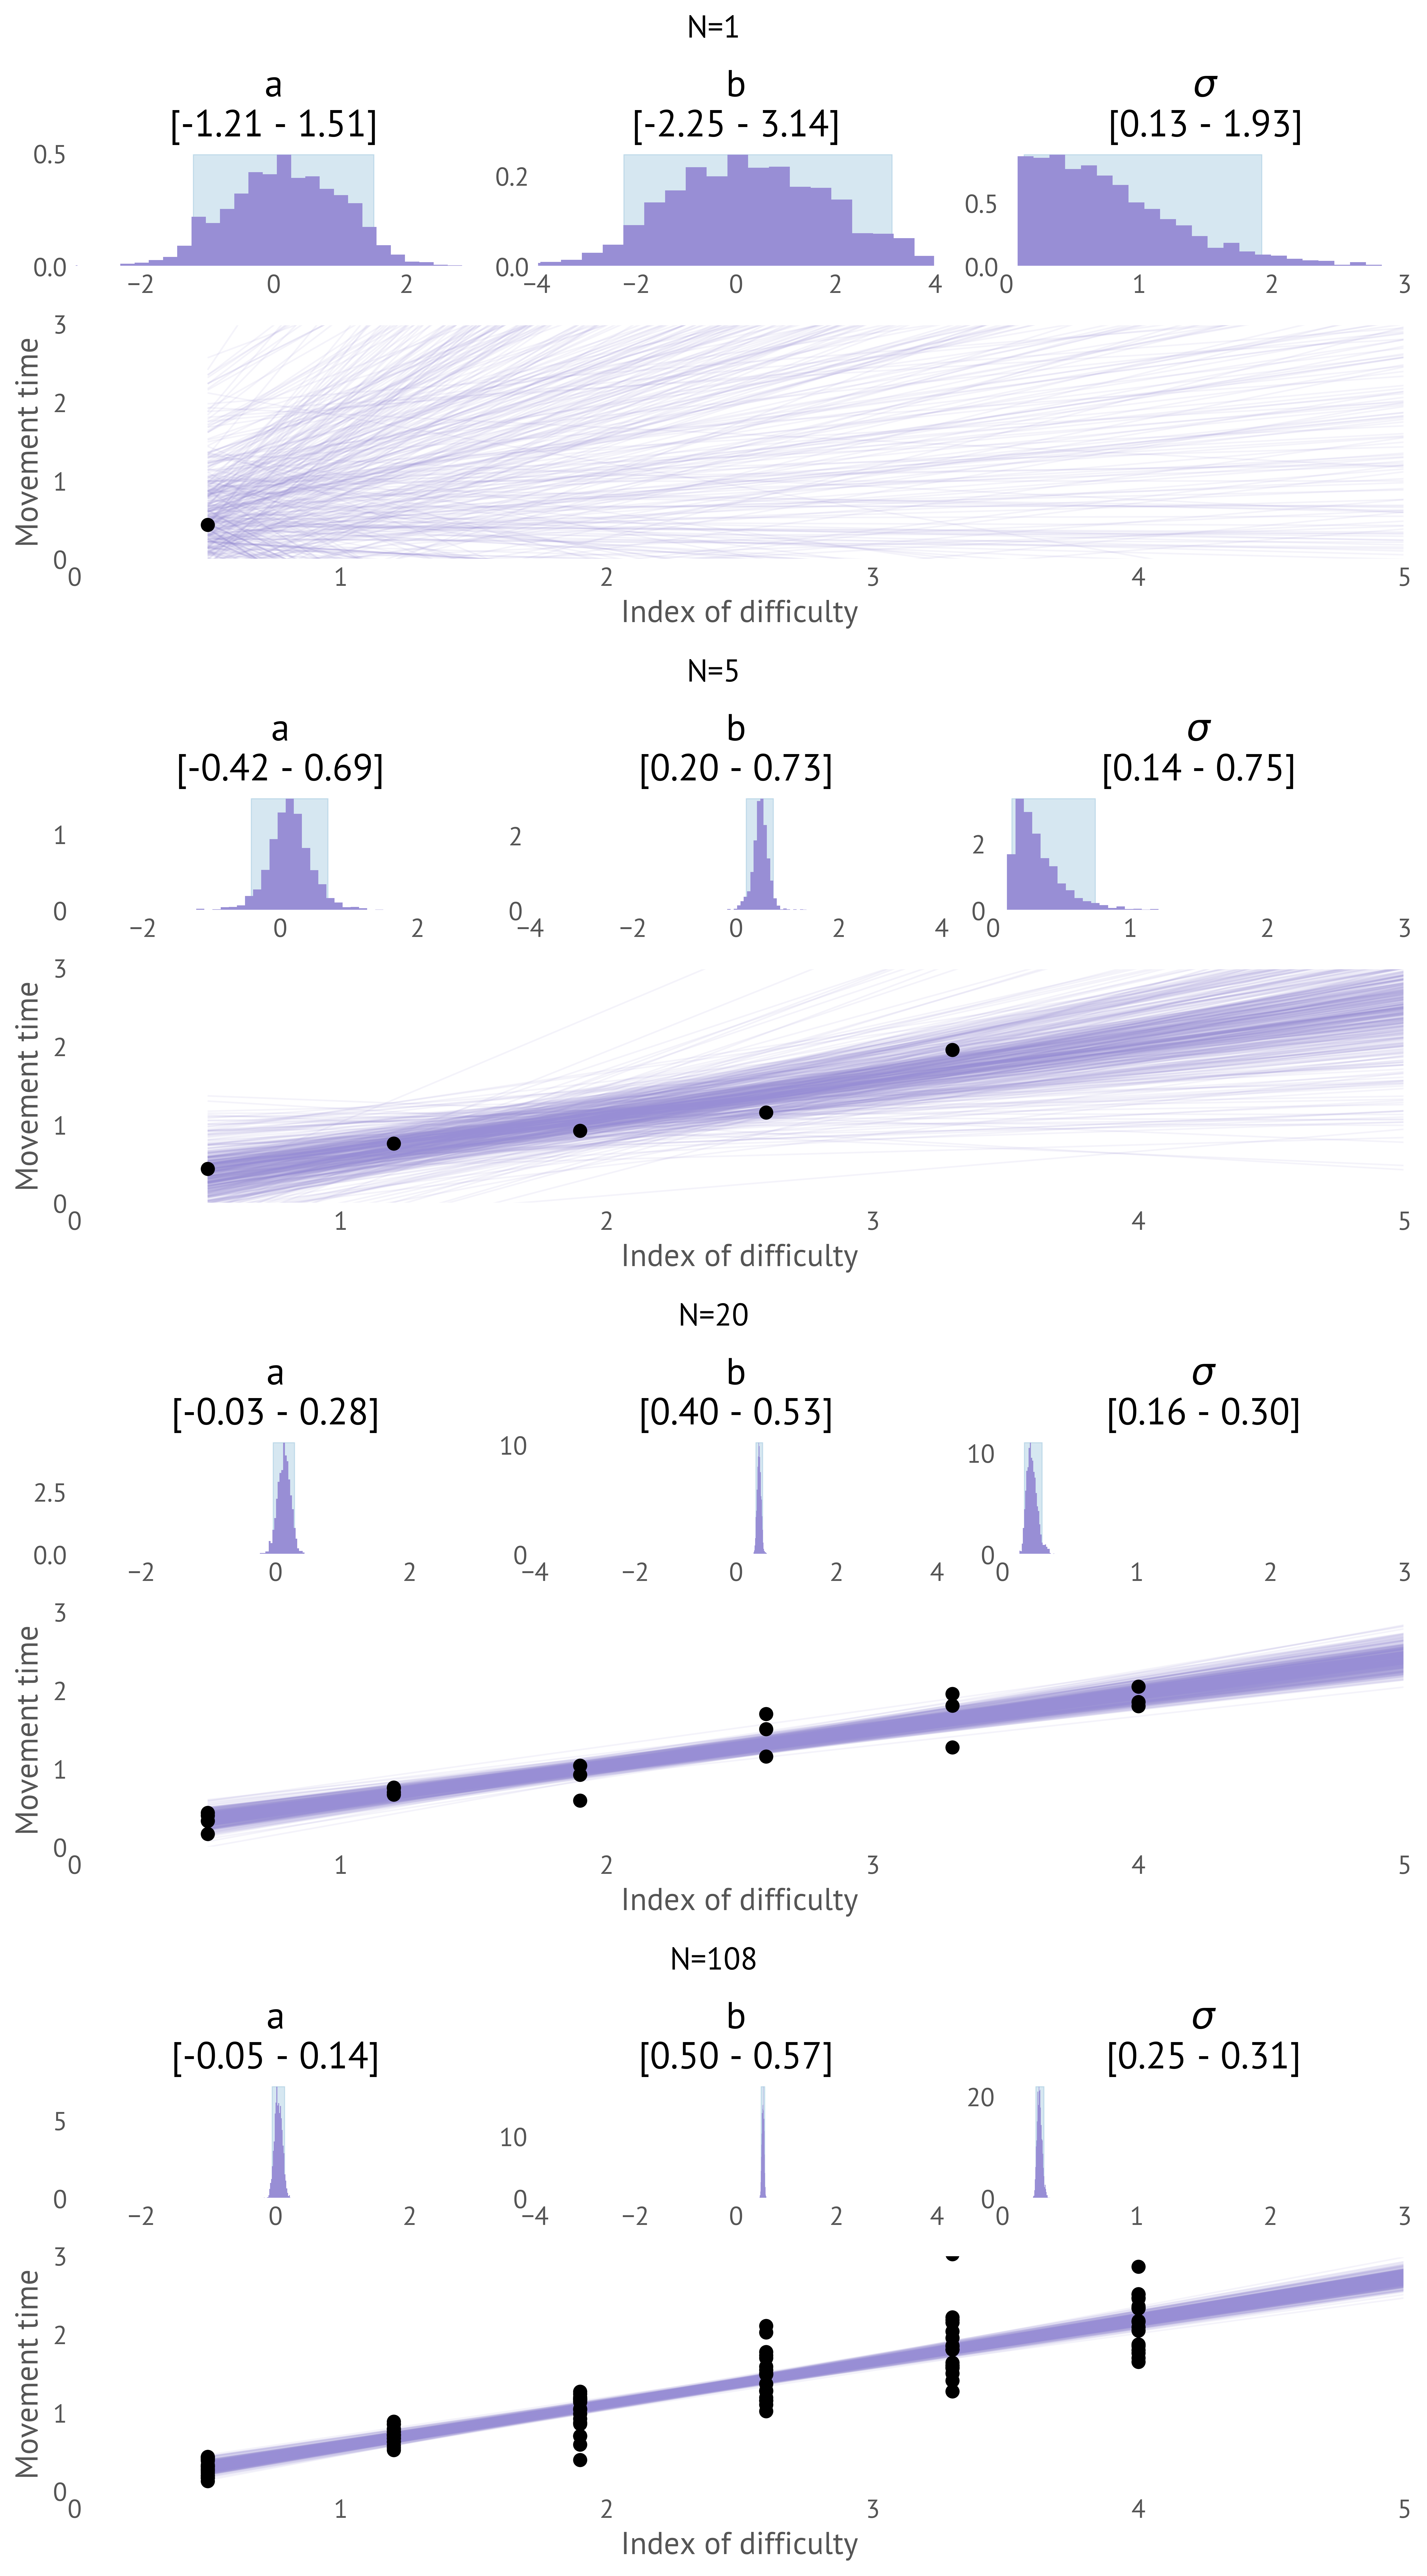
Our model outputs the likelihood of seeing a set of MT, ID pairs for any possible a, b, \sigma. Note: our model does not predict a, b, \sigma given MT, ID, but tells us how likely an MT,ID pair is under a setting of a,b,\sigma! An inference engine can approximate the posterior distribution following the observations. Figure 20 shows how the posterior and posterior predictive change as more observations are made (typically, we'd only visualise the posterior after observing all the data, in this case 6\times 18 =108 data points). The posterior distribution contracts as additional data points constrain the possible hypotheses.
Analysis
What is the value of a and b for this input device? A Bayesian analysis gives us distributions, not numbers; we can summarise these distributions with statistics. After the N=108 observations, the 90% credible intervals are a=[−0.05, 0.13] seconds and b=[0.5, 0.57] bits/second. What about \sigma? The 90% CrI is [0.25, 0.31] seconds. This gives us a sense of how noisy our predictions are; small \sigma indicates a clear relationship; big \sigma indicates weak relationship. What we can't do from this is separate aleatoric measurement noise (e.g. human variability) from epistemic modelling noise (e.g. perhaps Fitts' law is too crude to model the motions we see).
Alternative priors
What if we had chosen weaker priors? The inference is essentially unchanged even if we use very broad priors, as in Figure 21.
If we had reason to choose tighter priors, perhaps being informed by other studies, we'd also get very similar results, as show below. Note the effect on the predictions when we use only 5 data points (Figure 22) — we have much more realistic fits with the stronger priors in the small data case.
It's important to note that these are alternative hypotheses we might have made before we observed the data. If we adjust priors after seeing the results of inference, the inference may be polluted by this “unnatural foresight”. p-hacking like approaches where priors are interatively adjusted to falsely construct a posterior are just as possible in Bayesian inference as in frequentist approaches, although perhaps easier to detect. Alternative priors could be postulated if they arose from external independent knowledge; e.g. another expert in Fitts' suggests some more realistic bounds.
A new dataset
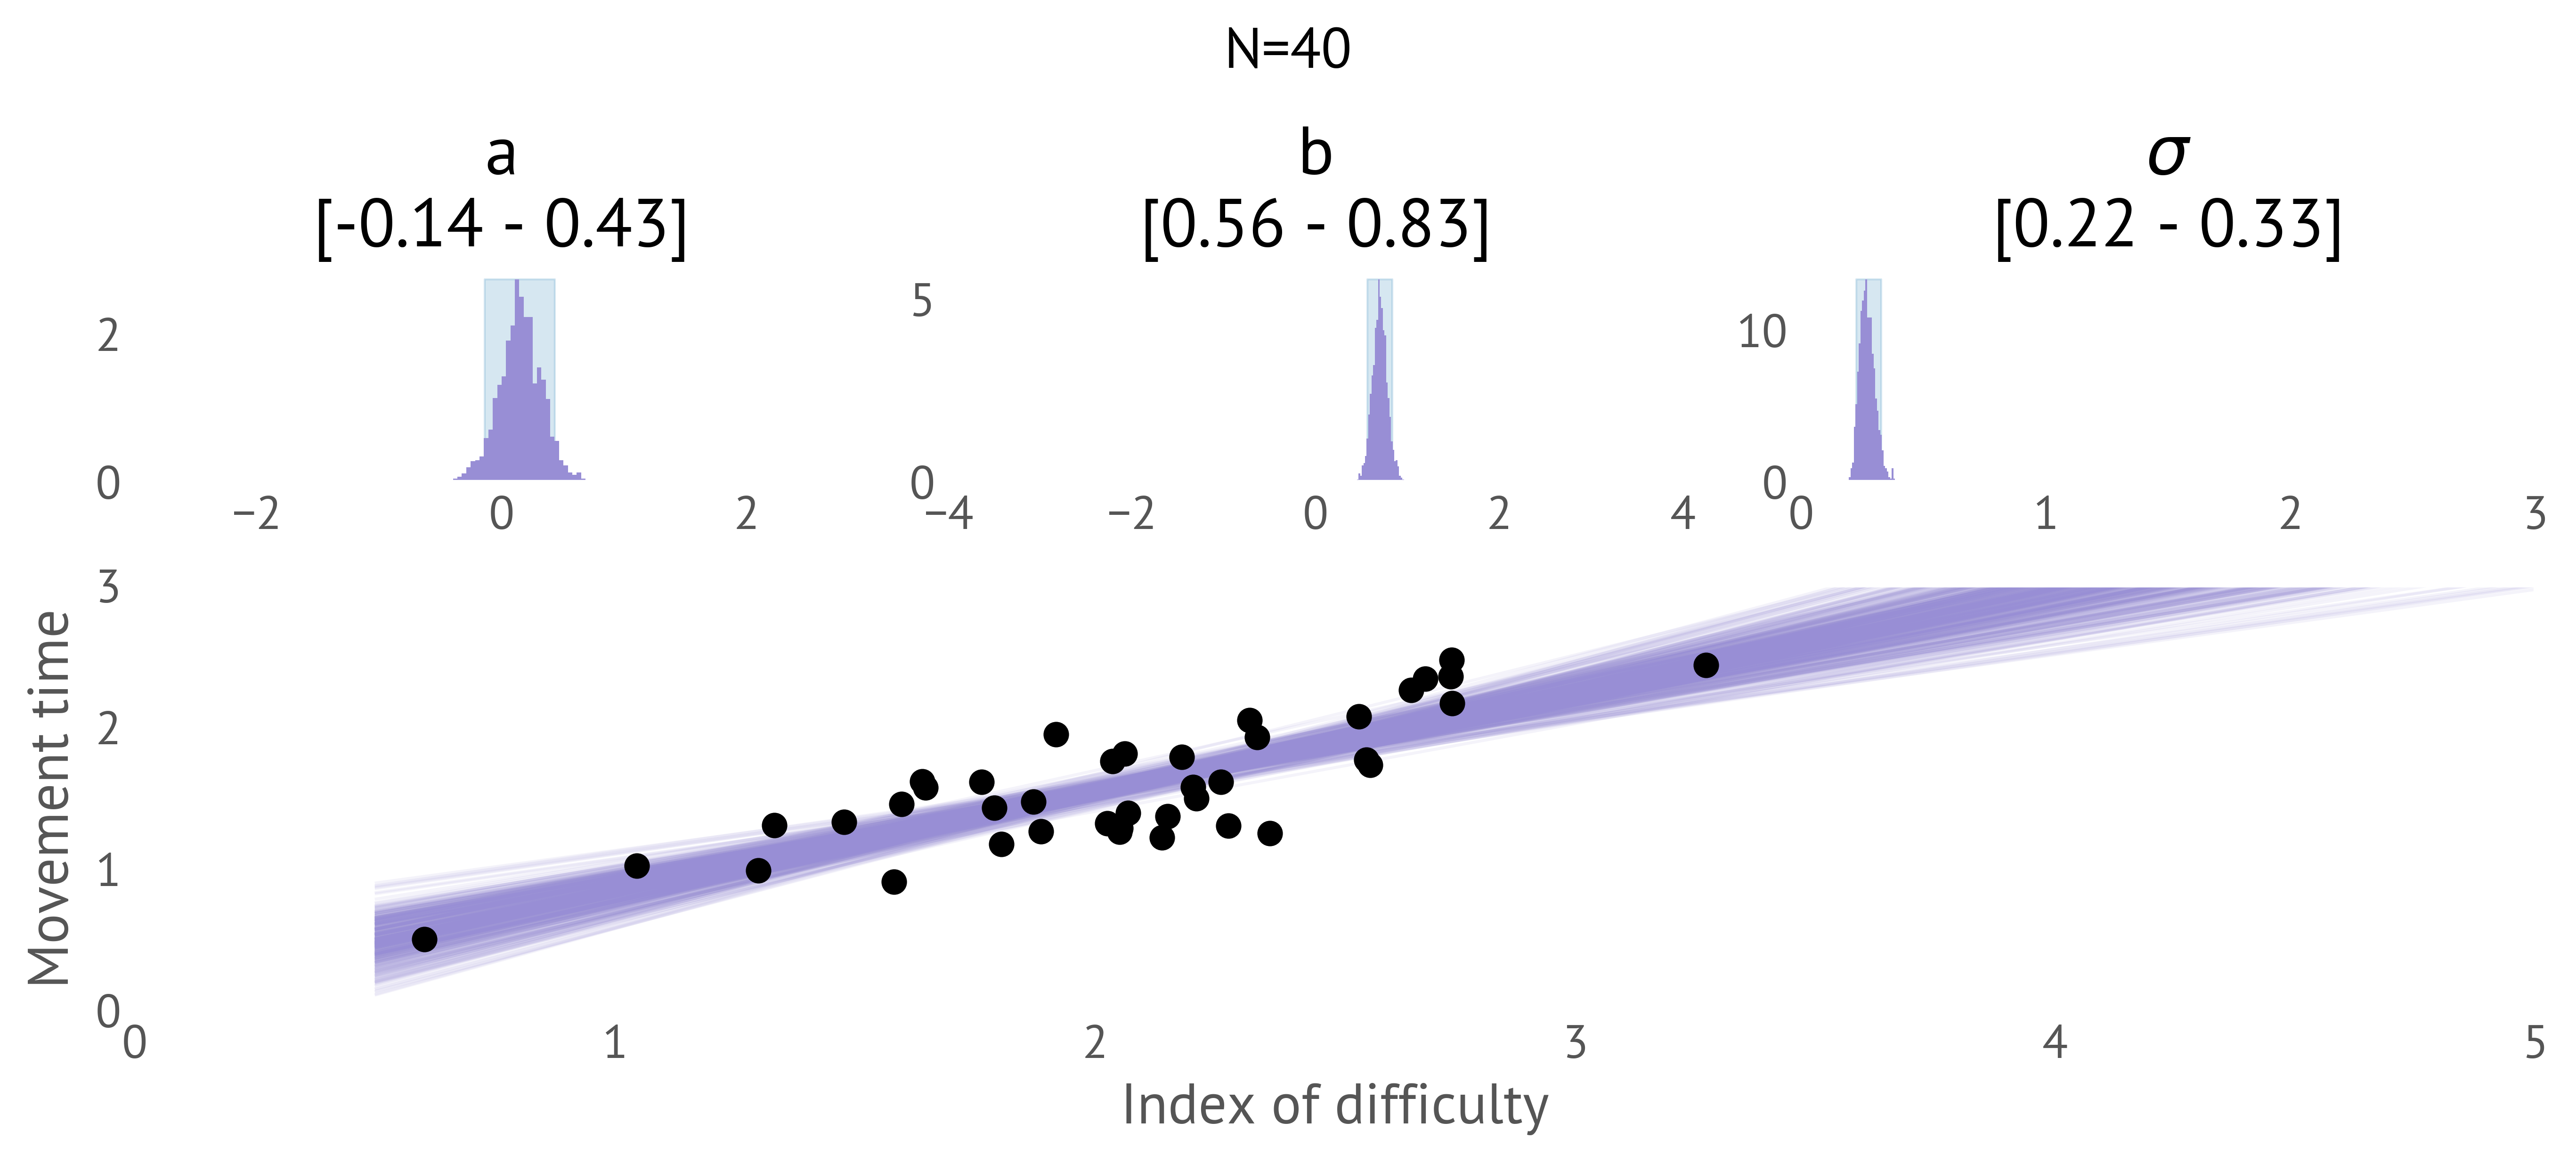
Perhaps we observe another dataset. In this case we have 40 MT, ID measurements from an in-the-wild, unstructured capture from an unknown pointing device (Figure 23). How likely is it that the b parameter is different in this dataset?
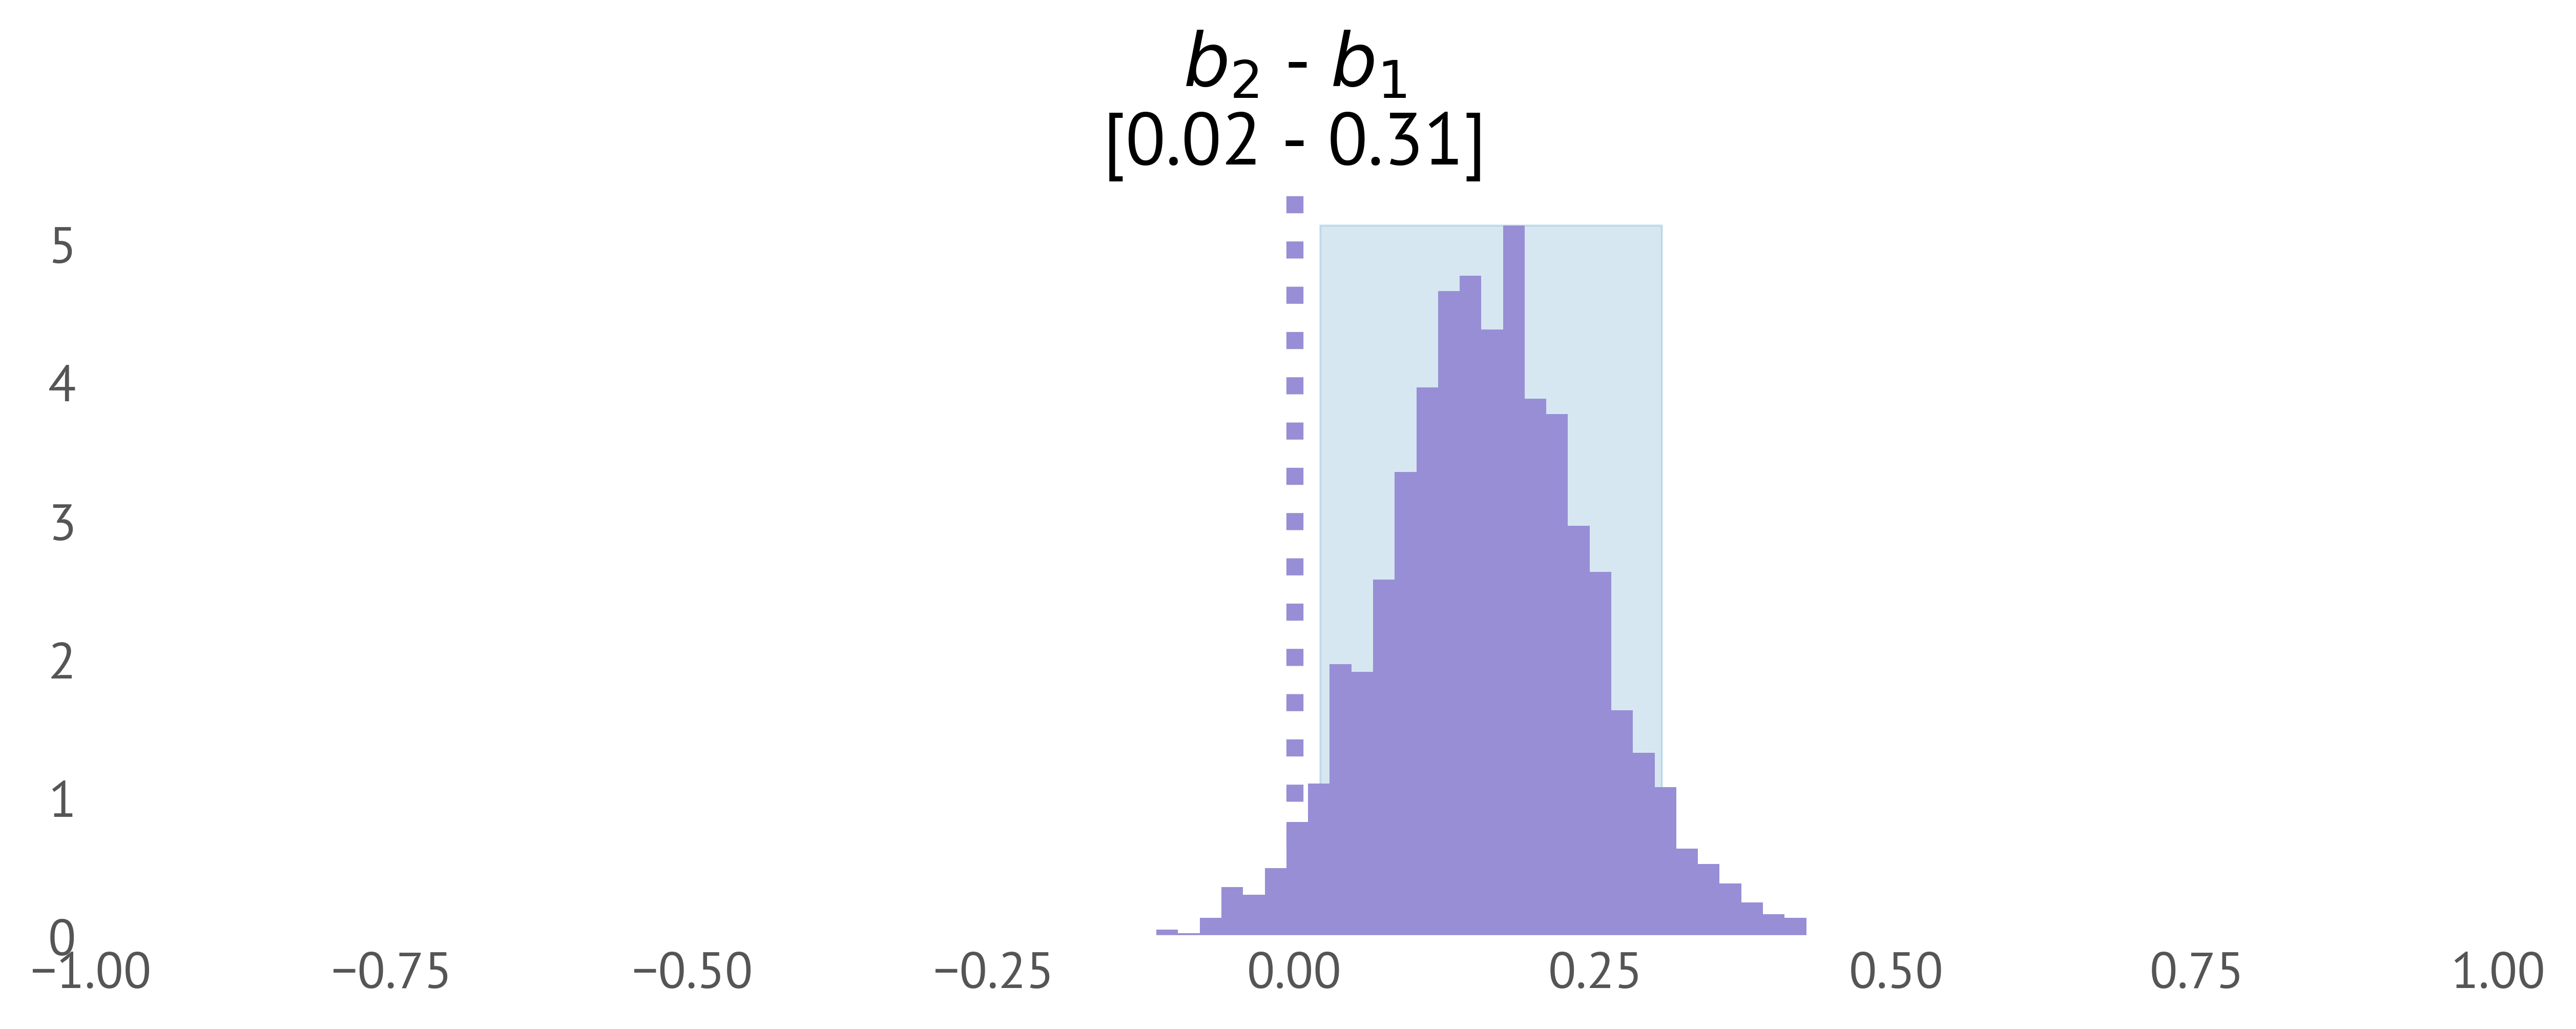
This question might be a suitable proxy for whether these 40 measurements are from the same pointing device or distinct pointing device. We can fit our model to these data (independently of the first model) and then compute the distribution of b_1 - b_2, the change in b across the two datasets (b_1 being the original and b_2 the new, in-the-wild dataset). This gives us a distribution (Figure 24), from which we can be relatively confident that the b value is different, and we are probably dealing with data collected from another device.
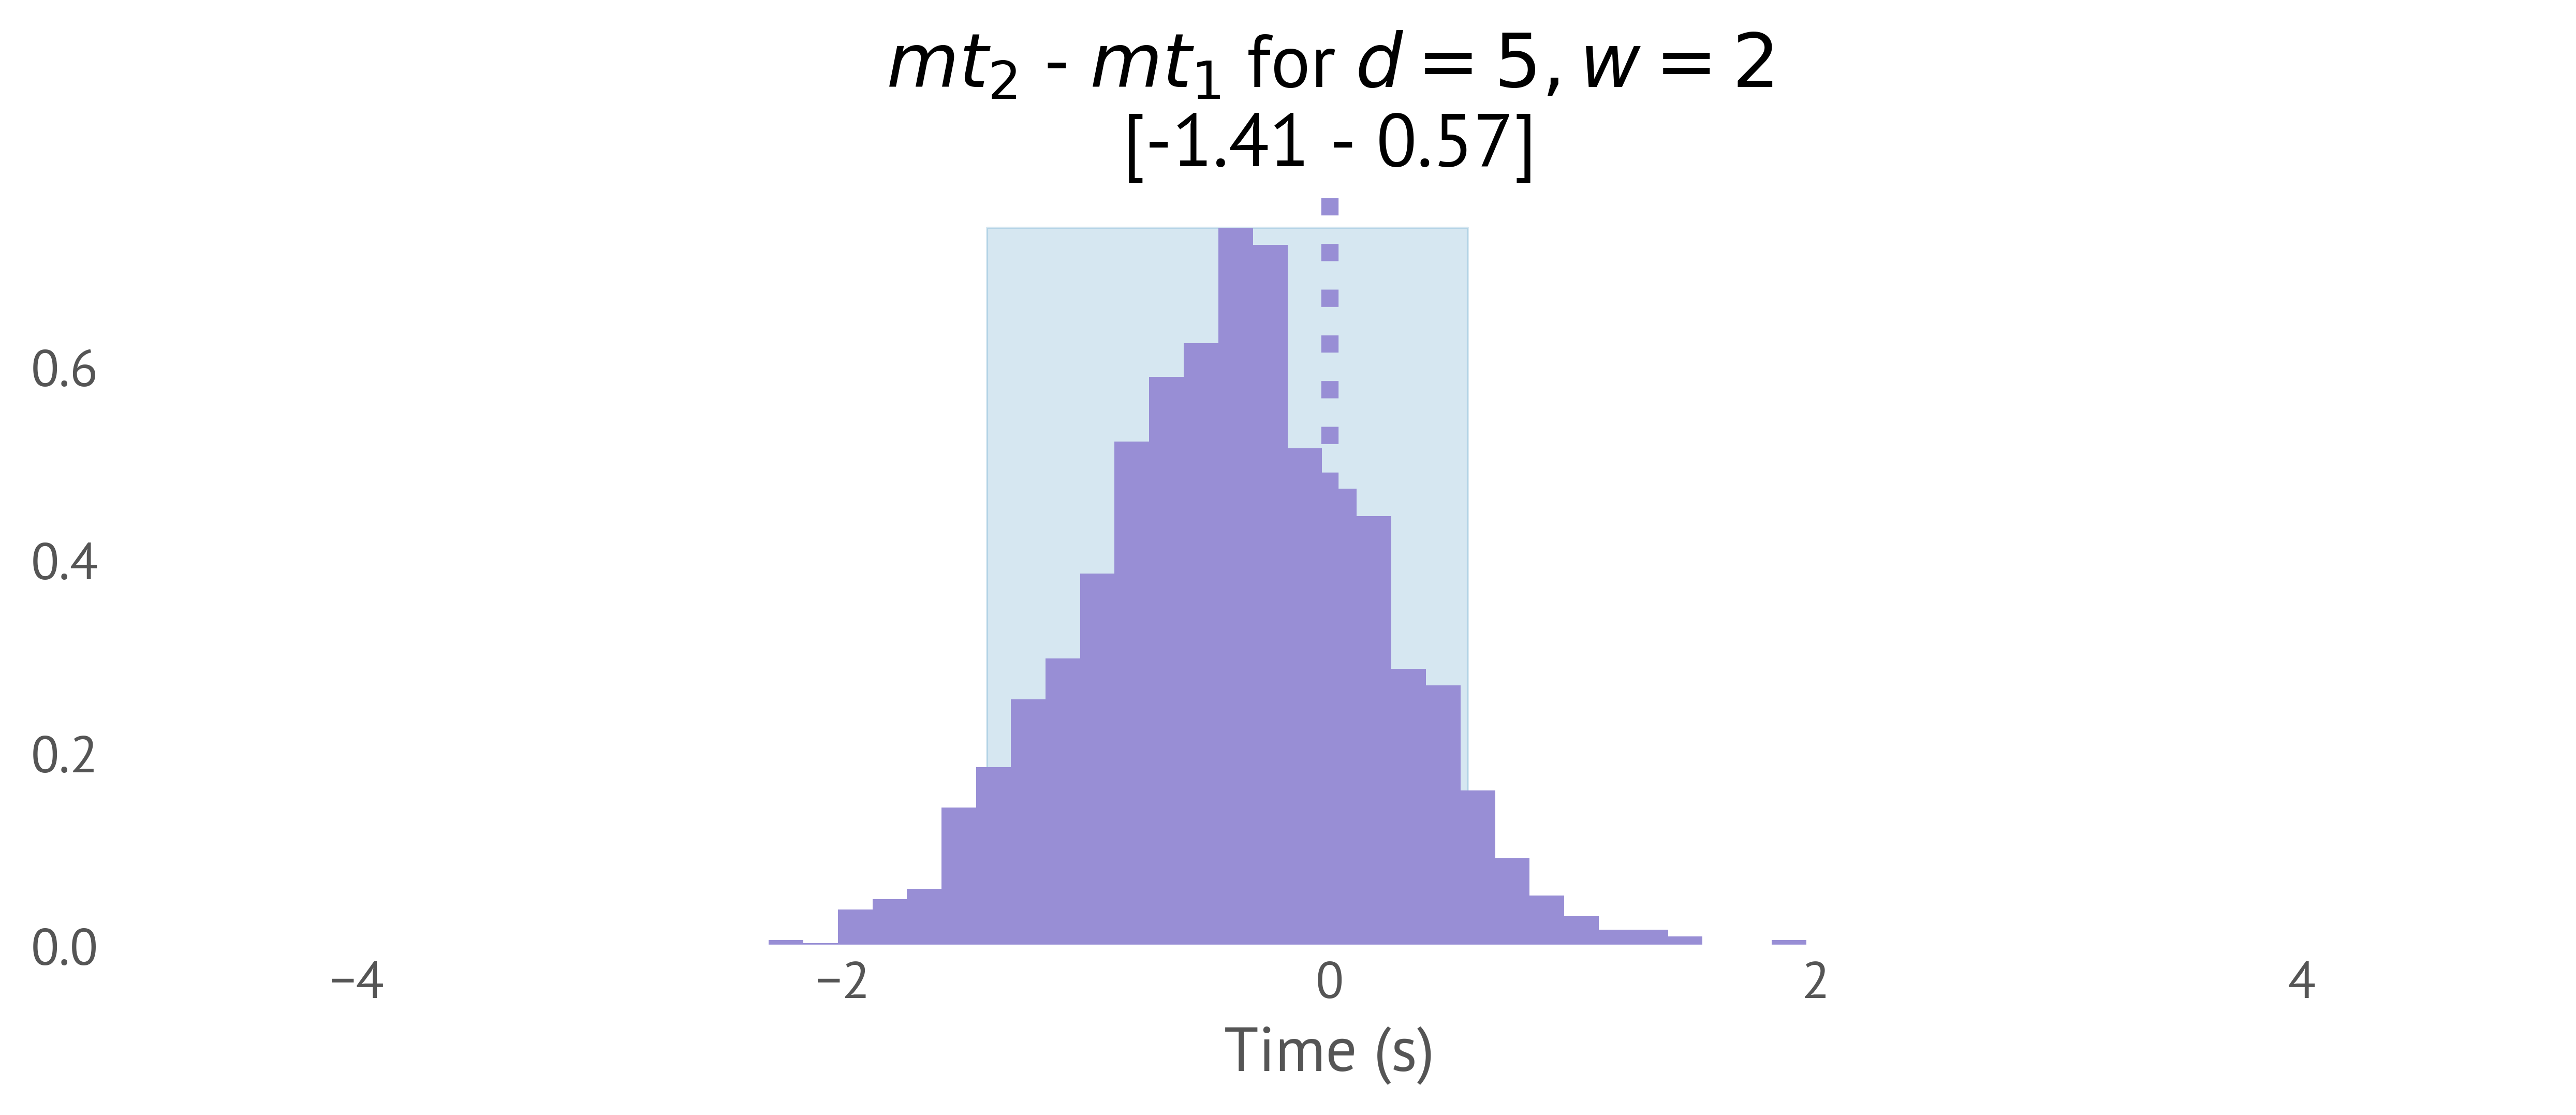
Since we have a predictive model, we can easily compute derived values. For example, we could ask the concrete question: how much longer would it take to select a width 2 distance 5 target using this second device than the first device. We can push this through our model and obtain the distribution shown in Figure 25.
What's the point?
Why did we do this? What benefits did a Bayesian approach give us?
- Uncertainty For one, we have realistic and useful uncertainty in our parameters. The credible intervals for our parameters are easy to interpret (there is a 90% chance that a lies in [−0.05, 0.13], given our model, priors and observations).
- Priors It is very easy for us to incorporate domain knowledge. If we had done studies before, we might have justified tighter priors. Even without other Fitts' law studies, we could have formed more informative priors than we did based on basic scientific knowledge; we'd expect that b has to be positive and we'd also expect that the human motor system cannot generate more than 30 bits/second. We can directly use this information in the inference. Or perhaps another researcher is sceptical of these priors and prefers to be less cautious. We can re-run the inference and get new results; we'll find in this case that the priors have very little effect on the results with this much data.
- Flexibility of modelling One advantage is that it is simple to write alternative models. When writing such models in a probabilistic programming language, the following modifications are one or two lines of extra code:
- We might assume that noise is actually Gamma distributed (or any other noise model) so MT=a+bID+\Gamma(\alpha, \beta). We'd just put priors on \alpha and \beta and run the inference again.
- We might assume there is some small quadratic term, perhaps MT=a+bID+cID^2+\mathcal{N}(0, \sigma). We'd put a prior on c that would suppose it to be small, because we know the relationship is roughly linear, and re-run the inference.
- Perhaps we assume that Fitts' law holds for between some range of IDs, but becomes increasingly linear in distance after targets get a certain distance away. We can write this as a model, and infer the unknown crossover point between Fitts' and linear behaviour: MT = a + b ID + \operatorname{max}(k(w-m),0) +\mathcal{N}(0, \sigma), adding two new parameters k and m
- We might instead assume that the parameters vary per-participant so MT = a_i + b_i ID + \sigma_i, and infer the parameter vectors a_1, a_2, \dots. In this case, the user ID i is observed.
- As a more sophisticated approach, we might assume that parameters vary per-participant, but that the participants parameters come from some common distribution (that generates a_i, b_i, \sigma_i.). This is a “partially pooled” model and encodes our belief that humans vary, but have similar characteristics, and can be a powerful way to efficiently model populations.
- Relevant hypotheses There is a distinct absence of statements about null hypotheses. These might be relevant and we could analyse the data with frequentist methods to answer them. But they probably aren't what we are really interested in this specific problem. Instead, we have relative likelihoods of hypotheses that do matter. For example, if we are interested in comparing our two input devices, we can make statements like “acquiring a (w=2, d=5) target has a 90% chance of taking [0.57, 1.41] seconds longer when using the second device”. Compare this to the statement “if we repeatedly ran this exact experiment, there is a less than 5% chance that we'd see differences equal to or bigger than this if the differences were purely random”.
Is this generative modelling?
Fitts' law isn't a particularly generative way to think about pointing motions. Fitts' law describes the data but it is not a strong explanation of the process and does not attempt to explain underlying causes. A more sophisticated model might, for example, simulate the pointer trajectories observed during pointing. We could, for example, infer the parameters of a controller we suppose is approximating how humans acquire targets, generating spatial trajectories. Bayesian inference could be set up the same way, but now we would be able to make richer predictions about pointing (for example, predicting error rates instead of just time to acquire, or properly accounting for very close or very distant targets).
- Observation: The cat meows around 2230 each night.
- To build a descriptive model, we could measure the time of each meow on a sequence of nights, and build a model by estimating a distribution giving probability of a meow given clock time. This would give us some ability to predict meowing episodes in the future. It describes the observations statistically and can be used for prediction, but it is a weak explanation.
- A more generative model would be built using expert knowledge to extract causal factors. The cat meows because it is hungry and it anticipates treats. Treats are administered when the humans go to bed. The humans go to bed around 2230. We can now build a more detailed causal model that links
clock -> bedtime -> anticipation -> meow <- hunger. This might not make better predictions of the next night than a descriptive model, but it does give us insight in counterfactual scenarios. If the hour changes due to daylight saving time, we'd expect the meowing to follow, because humans use clock time to schedule their lives. If the cat is well fed before bed time, the meowing will be suppressed. If the cat is alone, it won't meow. We have a model that generates meows as a function of hunger and anticipation, and anticipation depends on human activity which in turn depends on clock time.
Bayesian workflows
This worked example outlined the main steps in Bayesian modelling for this example. In general, how should we go about building Bayesian models in an interactive systems context? What do we need to define? How do we know if we have been successful? How do we communicate results? Workflows for Bayesian modelling are an active area of research [gelman_bayesian_2020] [schad_toward_2020].A high-level summary of the general process is as follows:
- Define a model. Ideally, we want a generative model that describes how we believe the world works, governed by a set of parameters that can vary. For example, say we were modelling the effect of frame rate variation on VR sickness. We would want to create a model that when fed a sequence of frame timings would output a probability of induced nausea. It would be possible but less desirable to use a general model like logistic regression. A better model would be constructed based on psychological and physiological models with parameters in meaningful units that represents our best knowledge of how the process truly works.
- Construct priors. We need to specify priors for every parameter in the model. We seek to find priors that are as informative as possible (and thus give us the most precise inferences with the least data) without introducing undue bias. Priors should be elicited from expert knowledge; from previous studies or published literature; or if nothing else, informed guesses with clear justifications. Priors should not be established by looking at the specific data under consideration! “Fitting” priors to data and then running inference with the same data inevitably biases the results.
- Test priors Bayesian models are executable and we can sample possible simulated observations before doing any inference — sampling from the prior predictive. We can and must check that the priors look sensible. This can range from a quick eyeballing of histograms to more in-depth analysis of summary statistics of the prior simulations. Verifying prior predictives with domain experts can save a great deal of pain later. These simulations are most valuable if the model is easy to interpret generatively. Simulating from the prior also lets us test the rest of the analysis pipeline in advance of observing any data and verify that visualisations and summary statistics will be computed as we want.
- Fit model With our model and priors set, and our data acquired, we can perform inference. This will eventually produce an estimate of the posterior distribution, often in the form of a trace from an MCMC process — a sequence of samples approximately drawn from the posterior.
- Tune and diagnose The inference process can go wrong. Poorly specified priors or models with awkward parameterisations can make inference engines go haywire. This may result in bad approximations or excessive computation time. Inference engines themselves have many settings that can be adjusted that affect the approximation process. It is essential to perform at least some diagnostics to verify that posteriors are being approximated accurately. Many standard packages will compute basic diagnostics automatically. Any problematic results will need to be corrected and re-run until diagnostics “run clean”.
- Test the posterior predictive Posterior distributions should be run through the generative model to generate synthetic observations from the posterior predictive. These should indicate a close match between the true observations and the generated samples from the fitted model; certainly better than samples from the prior predictive. This might be established by comparing expectations (like the mean and standard deviation) of the posterior predictive against the observations, or verifying that the observations would lie in sensible quantiles of the posterior predictive (e.g. not way out in the tails). More thorough testing might involve re-fitting the model, using the posterior predictive as synthetic observations, and verifying the posterior distributions are not substantially altered.
- Visualise and form summary statistics for the posteriors (and posterior predictive) The posterior distributions need to be visualised in some way to communicate an overall picture of the results. This is often challenging, because a model with many parameters can have many joint interactions that cannot all be seen. Reporting and visualisation should represent all uncertainty. This could range from showing a blurred contour onscreen (in an online probabilistic tracking scenario) to rendering histograms, Box plots, cumulative distribution functions, dot quantile plots [fernandes_uncertainty_2018] or violin plots (in a paper reporting on an empirical study). If necessary, summary statistics like means and standard deviations or credible intervals can be used to compress results into a few numbers. If decisions need to be made, then utility functions need to be defined and then combined with posterior distributions.
This workflow is presented from the perspective of performing an empirical analysis. The principles transfer to other uses of Bayesian models in interaction. For example, if we were building a probabilistic filter to track a user's head orientation, we would:
- build a model that predicted head dynamics (e.g. based on biophysics);
- define priors over likely poses;
- test that these did not look silly (e.g. by rendering them as head poses of a computer graphics character);
- estimate the model online from sensor inputs (e.g. using a particle filter);
- use diagnostics to make sure the particle filter is tracking (e.g. effective sample size)
- render a point cloud visualisation of the posterior distribution for the user.
Topics of special relevance to interaction design
The relation to information theory
Interaction can be seen as the flow of information between entities. In human-computer interaction, for example, information flows from users to systems to indicate intent, and information flows back via the display. Information theory, as pioneered by Shannon [shannon_mathematical_1948-2], is closely linked to probability theory and integrates cleanly with Bayesian approaches. In particular, we can measure, mathematically, the information required to change one distribution into another. This corresponds directly to how much information we need to pass through a communication channel, like a human-computer interface, to specify a new distribution.
The key concept is that of entropy, the measure of uncertainty in a distribution, sometimes characterised as a measure of the “surprise” samples from a distribution would have. Entropy is a single number that quantifies how uncertain a distribution is. It is often measured in units of bits and tells us how much additional information must be provided to uniquely determine the outcome from a distribution. For example, a distribution with an entropy of 4.3 bits requires knowledge of a little more than four definite yes or no questions to completely identify its value. A distribution with 0 bits of entropy concentrates all probability mass on a single outcome, so there is no surprise and no additional information needed to resolve the value.
Entropy is essential in determining how much information must be communicated through a channel to identify (select, in an interaction context) a specific outcome. When we perform a Bayesian update, we will move from a prior to a posterior in light of evidence. If the evidence has constrained the space of possibilities — that is, we have learned something from it — then we will have a precisely quantifiable reduction in entropy as a consequence. Interaction can be seen as a sequential update of probabilities to reduce a system's entropy about intended actions, as in Figure 26.
For example, in a pointing task, like operating a calculator app, we might have space divided into a 4×4 grid of buttons. Pressing one of the calculator's buttons selects one of 16 options. If we wish do so without error, this necessarily communicates 4 bits of information, as \log_2(16)=4. Whatever input we use, we need 4 bits of information to unambiguously choose an option. But this information does not have to come from the same source. If we know that the + key is pushed much more often than the \sqrt{} key, then we have pre-existing information. This prior belief would reduce the information required to operate the calculator by pointing, because there are effectively fewer options — less information is required because the selection is in a sense already part-way completed. We can represent more commonly used keys with fewer bits and less frequently used keys with more bits. We could, for example, permit sloppier pointing without increasing the error rate by interpreting pointing actions differently (e.g. by varying the effective size of the buttons). This is a process of decoding intent from uncertain input.
In the scenario of a user-system interaction, we can view the user as “bit-store” of state, which encodes an intention with respect to the system (for example, “please cancel this calendar appointment”). The user has to squeeze this intention through the communication channel of the interface to contract the distribution the system has over possible actions so that specific state change happens. Questions about how much information has to flow, and how quickly a decision is being made are most naturally framed in terms of entropy (Figure 27).
As a concrete example, a pointing device which follows Fitts' law [fitts_information_1954] might generate a maximum k bits/second for a given user, pointing device and interface layout. If there are n options, with equal prior probability, it will take at least \lceil (\log_2{n})/k \rceil pointing actions to reliably acquire a target. If there is a prior distribution over targets with entropy h, then it takes at least \lceil h/k \rceil pointing actions if we somehow interpret pointing actions more efficiently.
One of the earliest foundational papers incorporating Bayesian methods into an interaction loop is Dasher [ward_dasherdata_2000], a text entry system that directly links probabilistic language models to a dynamic target layout. Dasher implements an elegant link between information theoretic approaches and the problem of optimal selection via 1D pointing.
What is “approximate Bayesian computation”?
Approximate Bayesian Computation (ABC) is a likelihood-free way of performing inference. It is useful in the case where we have a simulator, but there is no likelihood “inlet”; no way of directly computing the likelihood of an observation given a parameter setting (imagine the Simulator class from earlier with the likelihood method deleted).
Instead, ABC approaches synthesize samples under different parameter configurations and compares these synthetic samples with observations to update distributions over parameters; in the simplest case, just rejecting parameter settings that result in simulation runs too different from the real observations. This approximation comes at a significant cost in terms of computational resources (large numbers of synthetic samples are needed) and inferential power (it is harder to infer parameters reliably). The huge advantage is that if we only have a simulator that can generate samples, even if it is not or could not be written in a probabilistic manner, then we can still perform Bayesian inference with it. This means that we can, for example, retro-fit “legacy” simulators that know nothing of likelihood. Alternatively, we can build Bayesian models for problems when it is conceptually challenging to even define what a likelihood function would look like.
For example, we might have a simulator that can generate likely arm trajectories in a target acquisition task, based on a biomechanical simulation of muscle activations. Given some arm trajectories from a motion tracker, and some priors over muscle activation patterns, how can we get a posterior distribution over muscle activations? The ABC approach would involve simulating many synthetic arm trajectories given the prior over muscle activations, selecting or weighting those samples that are close to the observed trajectories, and updating the distribution using the corresponding, known muscle activations that go with each synthetic trajectory. By averaging over many examples this can be used to infer an approximate posterior.
How do “Bayesian Networks” relate?
Bayesian networks, Bayes nets, or belief networks are ways of representing relationships between variables in a probabilistic model. They are a compact way of representing and managing uncertainty and have many applications in user interfaces. In most interaction contexts, Bayes nets are used to model relationships between discrete variables, as in the example below with binary outcomes. Models are represented as directed acyclic graphs (DAG) which specifies dependencies between variables. Variables are represented as nodes, and dependencies as edges. Variables may be observed or unobserved (latent). This representation makes it easy to factor the model into independent elements, and the directionality of edges captures the causal relation between variables. The relationship between variables is captured by conditional probability tables (CPTs) that specify distributions for outcomes of child variables given all possible states of their parents. There are various implementation strategies to efficiently encode conditional probability tables to avoid exhaustive specification of every possible combination. Inference is a process of updating the distributions on unknown variables when some variables are known — in small networks, with discrete nodes, this can often be done exactly. Approximations such as Monte Carlo methods can be applied for more complex models.
The example in Figure 28 shows a simple Bayes net with Boolean-valued variables (binary outcomes) that models focus change in a desktop user interface, its effect on user frustration and the effect of this frustration on heart rate and the probability of a user making an immediate error in typing. Focus changes can be induced either by the Alt-Tab hotkey or by a dialog stealing focus. Changes in focus affect frustration depending on their source. Changes in frustration can increase heart rate and/or make typing errors more likely. Given observations of some of these variables, and the DAG and conditional probability tables, we can answer questions like:
- What is the probability the user is annoyed, given that focus changed and heart rate increased? P(UA|FC, HR)\approx 0.56
- What is the probability of a heart rate increase given Alt-Tab was pressed and focus did not change? P(HR|AT, ¬FC)\approx 0.18
- What is the probability that Alt-Tab was pressed given that we did not observe a heart rate increase? P(AT|HR)\approx 0.38
- What is the probability that there was a typing error given that we observed a heart rate increase? P(TE|HR)\approx 0.16
- What is the probability that there was a typing error but no change in heart rate given that a dialog did not steal focus? P(TE, ¬HR|¬DF)\approx 0.046
It is important to realise that the directions of the arrows specify causal relations. The model describes the probability distribution of variables as being as consequences of the states of their parents. Inference about the state of variables can progress in either direction.
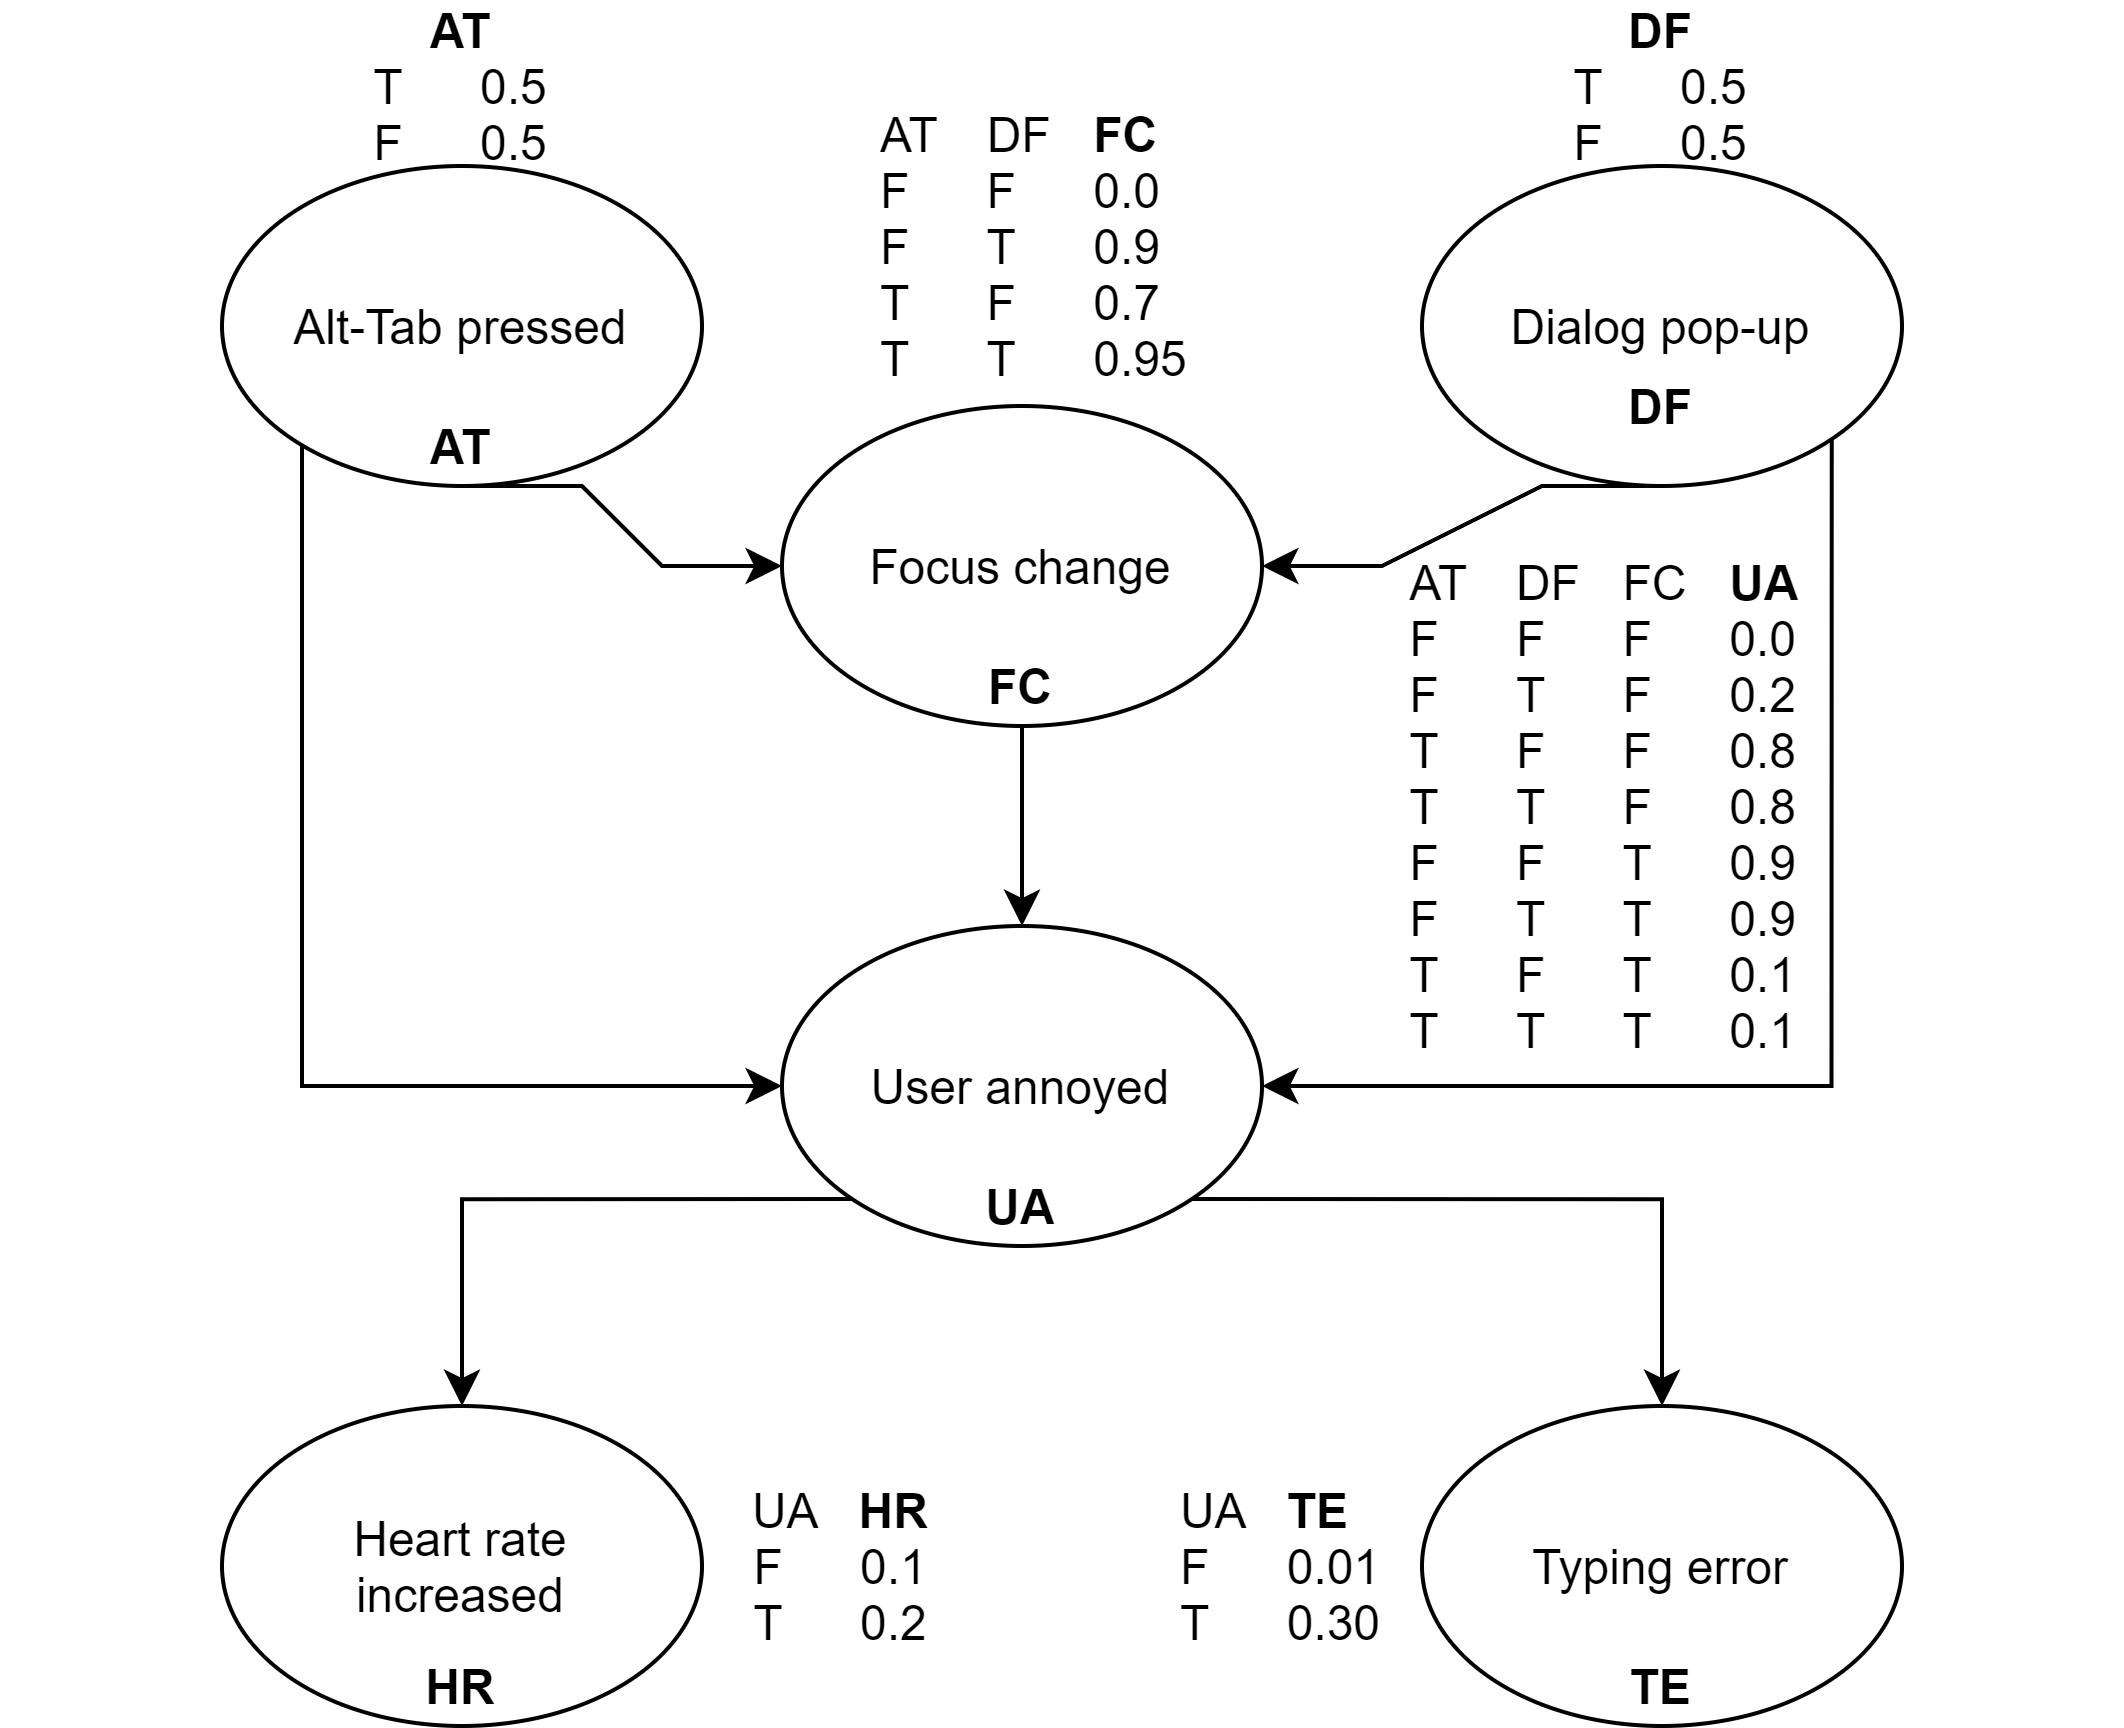
Bayesian networks have a long history in human-computer interaction. As well as inferring specific probabilities in a network, it is also possible to learn conditional probability tables from observations and thus “fit” a belief network with a given graph structure to observations. For example, in the scenario above we might log focus change events, heart rate, etc. in a set of user trials, and then use the event co-occurrences to update the conditional probability tables. This can be done in a Bayesian manner by setting priors on the CPTs and conducting ordinary Bayesian inference. In certain cases it is further possible, though computationally challenging, to infer the structure of the networks themselves from observations; i.e. to learn the graph structure as well as the conditional probability tables.
Belief networks can be extended to model sequences of observations over time, dynamic belief networks (DBNs). This includes models like the Hidden Markov Model (HMM) traditionally used in speech and gesture recognition. These models have dependency graphs that include state at the previous time step as parents and are powerful in modelling sequential processes. Hidden Markov Models, for example, are used to infer unobserved sequences of discrete states that are believed to be “causing” observations. An HMM for speech recognition might be used to infer a sequence of phonemes (unobserved states) from a sequence of acoustic features (observations), where the underlying model is that an phoneme sequence (i.e. spoken language) is being generated by a human speaker and “causing” the acoustic observations. The HMM can then be used to decode a probability distribution over possible phoneme sequences; this can be combined with a probabilistic language model to further refine the recognition process. Dynamic belief nets are closely related to probabilistic filtering, the online (i.e. inference during a process) estimation of states. Probabilistic filters encompass DBNs but the probabilistic filtering approach is typically identified with problems with continuous multi-dimensional unobserved states; whereas DBN approaches like Hidden Markov Models are typically applied in problems with discrete unobserved states.
What about “Bayesian nonparameterics”?
We have presumed, so far, that our models have a fixed set of parameters that define a configuration — a few moving parts that can be adjusted. Bayesian non-parametric methods do not assume a parametric form, and instead form distributions over possible functions that could have generated data. These models are constructed by defining a class of functions, such as a particular space of functions of variable smoothness, and then forming a prior distribution over all possible functions of this class. This prior is updated with observations to produce a new distribution over functions which are compatible with the data. In the simplest case, this might be distribution over all functions which pass through some data points, a distribution over interpolating functions of a specific smoothness.
The most important of these approaches is the Gaussian process (GP), an exceptionally flexible modelling tool. The details of the GP are beyond this book, but it allows the definition of a space of functions via kernels that define how nearby observations co-vary; this becomes a restriction on the smoothness of functions. GPs are a powerful way to interpolate and extrapolate functions from observed samples (Figure 29), with appropriate uncertainty, and have a huge range of uses in interaction design.

In the simplest cases non-parametric models like GPs can be used as smooth interpolators which maintain uncertainty, for example to predict expected offsets between actual touch and intended touch [buschek_user-specific_2013]. One important use in interaction design is as proxy objective functions in Bayesian optimisation. GPs are often used to represent an unknown function mapping properties of an interface to some quantitative measure, like reported satisfaction or response time. By sequentially updating the distribution over functions, optimisation can be performed at the same time as learning about the function. This can be an efficient way to optimise interface designs with humans in the loop.
What are probabilistic filters?
Probabilistic filtering is sequential Bayesian inference, and is used to estimate parameters that vary over time. This is particularly salient in interaction problems where we often have an ongoing interaction process and want to infer states as they are happening. This means we move from a prior to a posterior on a series of timesteps, at each step having an estimate of some unknown state. Probabilistic filters are of wide use in the interaction loop, particularly in problems like estimating a stable cursor from noisy sensing, or fusing together multiple sensors, perhaps running at different sampling rates. For example, we might be tracking the distance and movement of a user's hand to a mobile device screen, based on a Doppler return from an ultrasonic sensor. This sensor might give us both crude and noisy estimates of distance but reasonably accurate velocity estimates. How can we fuse this information to obtain reliable estimates of hand distance? This involves a predictive model over time.
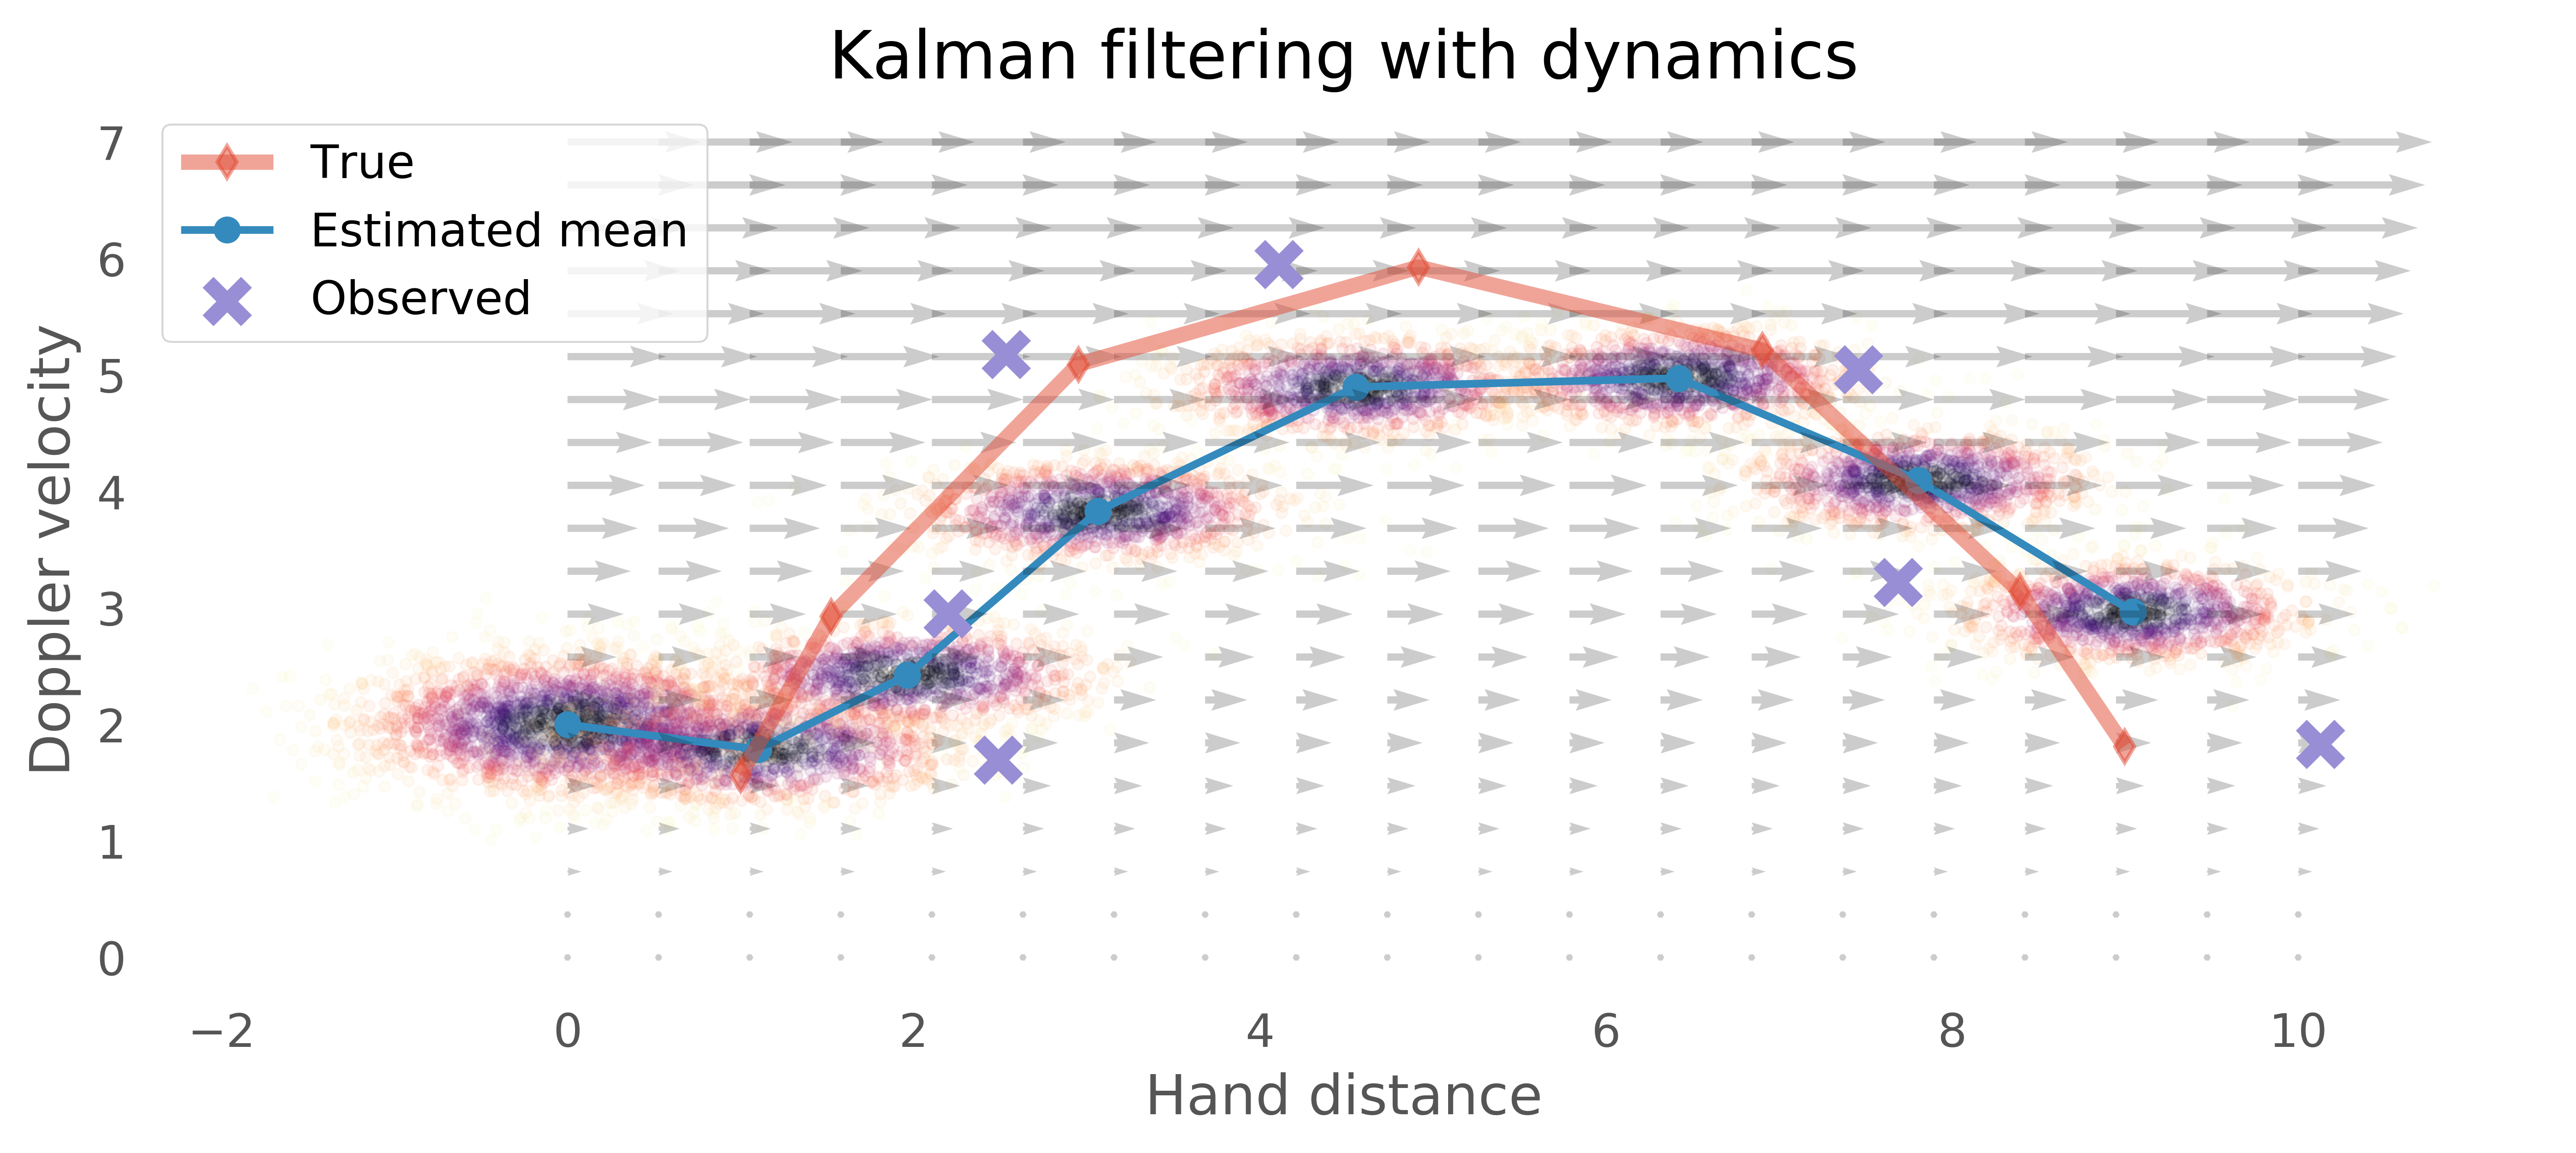
We can treat the true position of the hand as an unobserved parameter and estimate it from sensor data using Bayesian inference. A simple probabilistic filter uses posteriors from the previous time step to form the prior in the following step. To account for the passage of time, dynamics are applied to the posterior before it becomes the next prior (Figure 30). These dynamics are a predictive model that moves the distribution forward in time. The dynamics can often be very simple, and can involve parameters that are also simultaneously inferred. For example, we might assume that hand position changes by the current estimated hand velocity over a fixed time interval. We can update both position and velocity using ordinary Bayesian inference; then apply the velocity to the posterior distribution of positions; and feed this forward to the next time step.
Techniques like (unscented [wan_unscented_2000]) Kalman filters [babb_how_2015] and particle filters (also called sequential Monte Carlo filtering) make implementing probabilistic filters in interaction problems straightforward — once the modelling is done — and reasonably computational efficient.
Facets of Bayesian methods for interaction design
Bayesian approaches intersect with interaction problems in a several ways. Five of these facets are outlined in the sections below:
- Bayesian inference at interaction time, inferring the intention of a user in the control loop.
- Bayesian optimisation at design time, efficiently optimising designs with humans in the design process.
- Bayesian analysis at evaluation time, analysing the outcomes of an empirical interaction work.
- Interaction to support Bayesian modelling, through visualisation, workflow support and interactive model construction and exploration.
- Bayesian models as an approximation for human cognition, to guide the design of interactive systems with well-founded predictions of user behaviour.
Optimal mind-reading: How can Bayesian methods work out what a user wants to do?
Bayesian methods can be used to represent the problem of interaction itself — how does information flow from human to computer? This can be used to derive robust models based around inference of intention. Strong prior models of what we expect users to do allow us to extract maximum value from input and preserve uncertainty about user intent. If we already know what intentions are likely to be expressed, we do not need as much information to reliably determine the true intention. This is a model of interaction founded in the idea of the interface as a concentrator of belief, whose mechanics are driven by the logic of probability. Such an interface represents, manipulates and displays uncertainty as a first-class value [schwarz_framework_2010] [schwarz_monte_2011]. This can extend throughout the interaction loop, from low-level inference about user state from sensors [rogers_anglepose_2011], interpretation of pointing actions [grossman_probabilistic_2005], probabilistic GUIs [buschek_probui_2017], text entry [ward_dasherdata_2000], error-tolerant interfaces [williamson_efficient_2020], motion correlation [velloso_probabilistic_2021] and 2D selection [liu_bignav_2017-1].
We can conceive of an interface as a system that tries to infer what the user wants. We formulate a distribution over possible outcomes (e.g. over items on a menu), and an associated prior (e.g. from historical frequencies of interaction). We then update this probability distribution using observed inputs (e.g. the sequence of motion events from a pointing device).
Bayesian probabilistic interfaces let us formulate the intent inference problem in this way. This has some interesting effects:
- we can consistently introduce priors to imbue our interfaces with “intelligence”, without special ad hoc hacks;
- these priors can include static, historical models,
- or can come from other input streams (“sensor fusion”)
- or from preceding states to fuse together information over time (“probabilistic filtering”).
- we can simulate into the future and predict likely future actions (and e.g. pre-cache likely responses).
- we can incorporate models of how interaction will unfold (e.g. what does a pointing movement look like) directly into our interface;
- we can feedback and display uncertainty to the user and make the behaviour of an interface more interpretable and predictable;
- we have a distribution over outcomes, and we can choose appropriate decision rules to actuate events. This can incorporate utility functions to account for different values that events might have.
This view on interaction sees user intentions as unknown values which are partially observed through inputs. The time series of inputs from the user give a partial, noisy, incomplete view of intention inside the user's head, along with a great deal of superfluous information. This equivalent to the information theoretic viewpoint of an interface as a noisy channel through which intention flows.
We try and infer a generative model which is a simplified representation of intention and how it is mediated and transformed by the world. The stronger model we have available, the more effectively we can infer intention. In this view, improving interaction (or at least input) comes down to more efficiently concentrating probability density where a user wants it to go. A better pointing device reduces uncertainty faster; a better display helps a user understand how best to target future actions to concentrate belief as desired; a better model of the user intentions concentrates belief with less explicit effort on the part of a user.
Fast tuning in a noisy world: How can Bayesian approaches be used to optimise user interfaces?
In an optimisation problem we have one or more objective functions (each a single numerical measure of goodness or badness), which depend upon some parameters, which we are interested in adjusting to minimise the objective function, usually bounded by some constraints. Many design problems can be framed in these terms. As an example, we might want to improve an aspect of a user interface, like the scrolling speed of a photo viewer. This has an adjustable parameter (speed), bounded by some maximum and minimum speed (constraints), and we could derive a measure of performance, like the reported subjective satisfaction, as our objective function.
Numerical optimisation is an extremely powerful tool to solve these types of problems, but it developed in engineering contexts like the design of airplane wings where strong mathematical models were well established and precise measurements were practical. Objective functions, however, are not always known, as is very often the case in interaction design. We would not expect to any good model of satisfaction as a function of scroll speed, and it would be impractical to imagine deriving one from first principles. We may instead have a situation where we can only measure the value of the objective function at a few definite parameter settings, perhaps with significant measurement noise. In the scrolling example, we are free to sample different scroll speeds and ask users how they like it. Acquiring measurement points like this is expensive if humans are in the loop, so it is important to be parsimonious in sampling possible parameter settings. Humans are expensive to measure, noisy in their actions and not governed by simple mathematical formulae.
These issues motivate the use of a proxy objective function, a model that we learn from data that approximates the functional relationship between the parameters and the response (Figure 31). We now have to deal with two problems: which specific example parameters (speeds, in the example) should we test with users; and how should we deal with the fact that the measurements we make may be noisy. We certainly don't expect to be able to repeat an experiment with a fixed scrolling speed and get the same satisfaction level. These are problems well solved by Bayesian optimisation, where we form a distribution over possible proxy objective functions, update these from measurements, and can sequentially optimally select the most informative next test to make, taking into account the (epistemic) uncertainty of our model and the (aleatoric) uncertainty of our measurements.
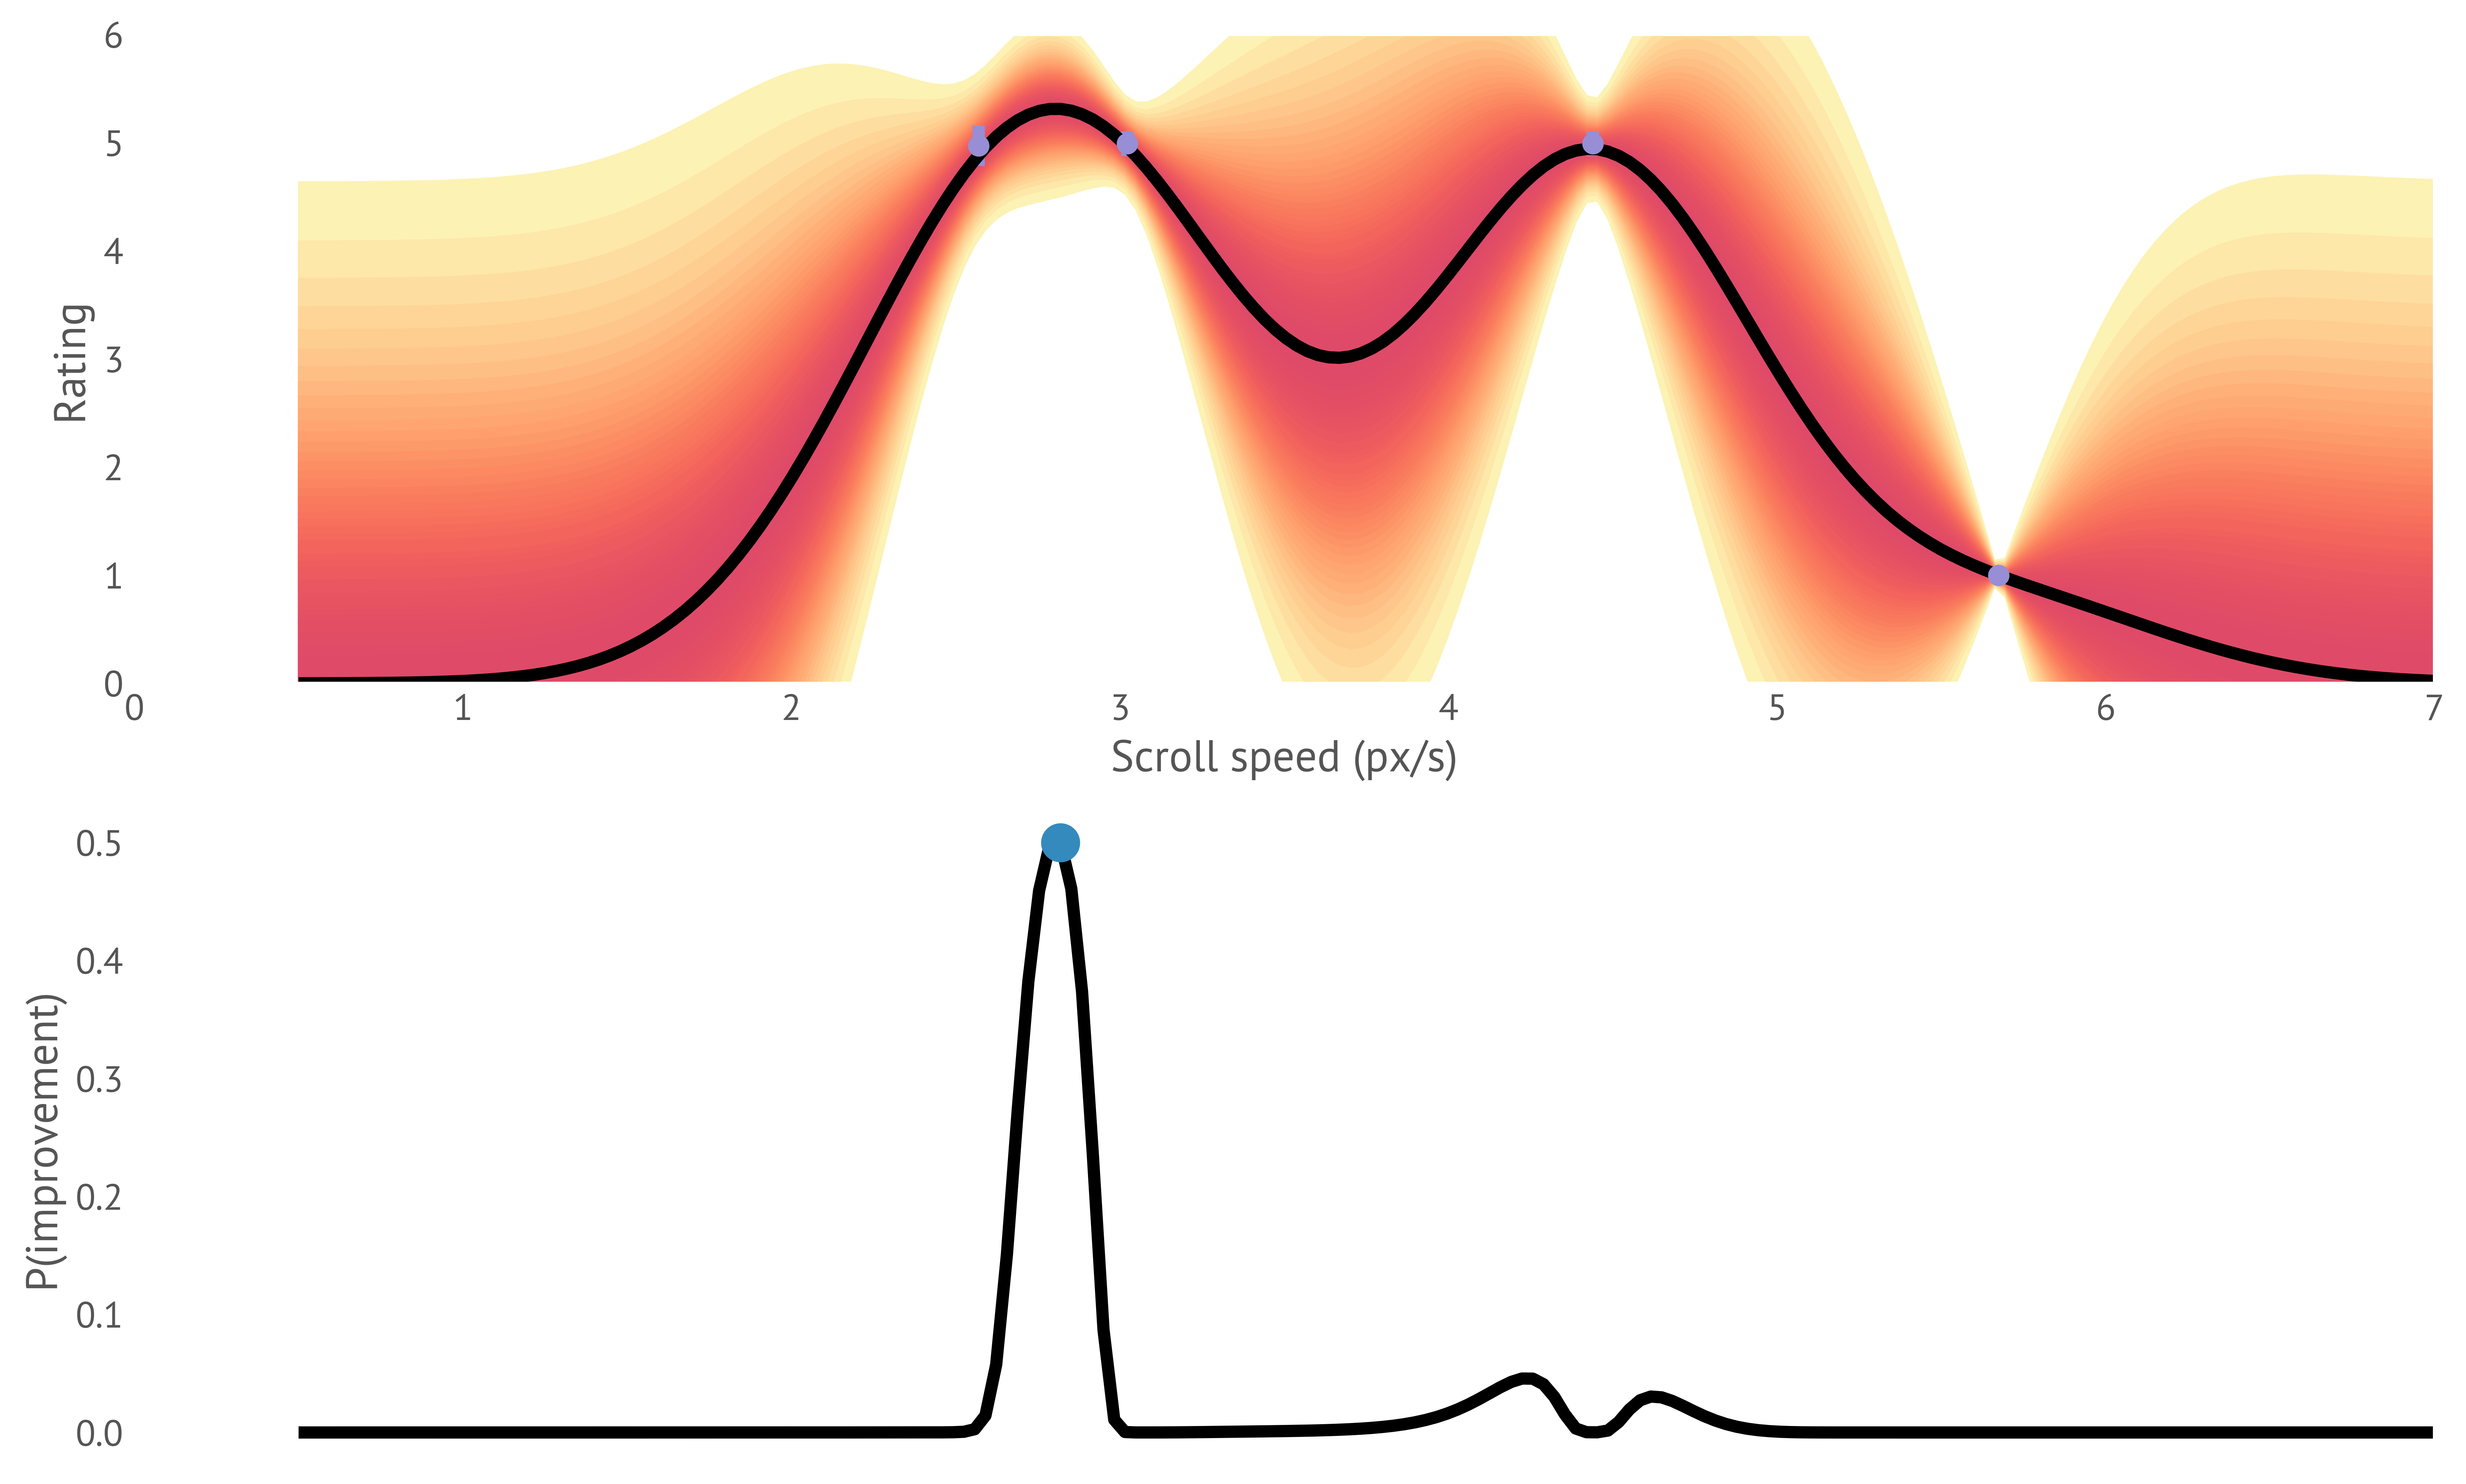
This can range from simple Bayesian A/B testing to sophisticated modelling of user behaviour at a fine level of granularity. Bayesian optimisation can be applied to a huge range of problems with expensive or noisy functions, from inferring subjective preferences [brochu_bayesian_2010], effective interface design [dudley_crowdsourcing_2019] to optimising touch sensor configurations. Proxy objective function models like Gaussian Processes [rasmussen_gaussian_2003] are well-supported by software packages and can often be slotted straight into a HCI problem. We can still combine these proxy objective functions with strong priors. As we incrementally improve our priors, our optimisation automatically becomes more informed and the sampling of measurements becomes more efficient.
Evaluating with uncertainty and limited data: How can Bayesian methods be used to analyse the results of human-computer experiments?
Human-computer interaction, by its very nature, depends heavily on the evaluation of interactive systems with users. Empirical evaluations are a basic and near universal aspect of HCI research and practice.
Bayesian approaches offers a potentially superior way of analysing some kinds of quantitative experimental work that arise in HCI. Experiments of all types result in numbers, but we know that the interpretation of these are subject to uncertainty; this is why we have statistics. Statistics is divided into two schools of thought: frequentist statistics, which encompasses classical approaches such as null hypothesis testing widely used in HCI; and Bayesian statistics, which involves quite distinct principles of inference, reasoning from a prior to a posterior. These two schools of thought remain bitterly divided over the correct way to interpret data. Kay et al. [kay_researcher-centered_2016] motivate the use of Bayesian statistics in the evaluation of HCI experiments, and put forward the case that Bayesian statistics are a better fit to the research practices in HCI; particularly in the re-usability of analyses from previous work and dealing with small sample sizes and weak effects. The awkward fit of “dichotomous inference” (does this effect exist or not?) that is the focus of frequentist methods to interaction design has also come under criticism [besancon_continued_2019].
It is important to note that both frequentist and Bayesian methods are valid ways of interpreting data, but they answer different questions and have distinct trade-offs. For historical reasons, empirical research in psychology-adjacent fields such as HCI have almost exclusively focused on frequentist methods, particularly null hypothesis testing (NHST). While powerful and well-understood, they are not always well suited to answer the questions that we wish to investigate in HCI, and in the worst cases degrade into cargo cult statistics (“just slap a t-test on it and hope for p<0.05"). Bayesian methods are no less susceptible to poor research practices, but they do require a more explicit consideration of the problem.
From an interaction design perspective, Bayesian approaches can directly answer questions of interest and can incorporate first-principles models from domain experts. They are well suited to problems where there is small data, where large controlled studies may not be practical or desirable. Bayesian statistical models make it easy to incorporate complex models, such as hierarchical regression. There are opportunities for novel and efficient experimental designs (e.g. online Bayesian experimental design) and practical meta-analyses. The advance of easy-to-use packages for Bayesian inference (e.g. stan, pymc3, brms, pyro) makes powerful Bayesian inference models reachable for non-specialist researchers. “Statistical Rethinking” [mcelreath_statistical_2018]] is recommended reading as a non-HCI introduction to Bayesian data analysis. Phelan et al. [phelan_prior_2019] give some guidance for the application of Bayesian models specifcally in human-computer interaction.
We cannot adequately describe the distinction between the two statistical schools of thought in this chapter. We refer interested readers to the recommended reading at the end of the chapter. A brief summary of the distinctive aspects of Bayesian approaches to designing and interpreting empirical work for interaction designers is summarised below:
- Bayesian methods require priors to be defined. Frequentist methods do not. This has several consequences:
- we have to be able to come up with justifiable priors, which may be hard;
- but if we do have them, we can use them (and frequentist methods cannot);
- our priors force us to “lay our cards on the table” and make our assumptions explicit;
- priors are actionable and scrutable, in that we can visualise or otherwise explore their consequences.
- Bayesian methods answer questions about the specific evidence in this instance, given the priors. Frequentist methods answer questions about long-run behaviour, without regard to priors. In HCI, we often only can ever have one experiment and may be less concerned about objective statements about the long-run behaviour.
- Frequentist methods are ideal to establish if an effect exists (as opposed to a random occurence), in the context of randomised controlled trial. This is, for example, vitally important in medical contexts. In HCI, such problems do occur, but there are other research investigations of interest that do not fit into this dichotomous mode of thinking, or for which randomised controlled trials are not feasible or meaningful. In these cases, a Bayesian approach may be more flexible.
- Bayesian methods can be used for dichotomous analyses, using Bayes factors to compare the relative likelihood of two competing hypotheses with the same evidence. However, this is sensitive to the choice of priors and therefore requires particular caution.
- Bayesian methods are flexible regarding combining evidence acquired at any time, from any source. It is possible to run a Bayesian design where experiments are run until a result is established with a certain degree of confidence. This is harder to do correctly with a frequentist approach. Likewise, it is easier to combine multiple studies in a Bayesian framework than it is to conduct a meta-analysis of studies in a frequentist framework. A Bayesian framework can feed the results of previous studies in directly as priors.
- Many frequentist methods have to be applied very carefully to preserve their validity (for example it is essential to apply corrections to preserve false positive resistance in the presence of multiple tests on the same data). Bayesian methods still require care in application but often break in more obvious ways.
- All modelling involves a bias-variance trade-off. A more complex model with more parameters will require more evidence to be constrained than a simpler model with fewer parameters. In a Bayesian framework, this is usually easy to inspect; the posterior distribution will tell us how informed the parameters of our model are. This can be harder to reason about in frequentist models.
- Bayesian methods can use models of essentially any form that can be computed, including complex simulators. Frequentist methods require a more limited class of models.
- Bayesian models require the statistical model to be defined in detail (e.g. as a program), which may require more work, but this model is a free choice. Frequentist methods can devolve into picking an approach from a zoo of tests and procedures, which may be an awkward fit.
- It is easy in Bayesian approaches to build hierarchical models, where the parameters at one “layer” depend on another “layer”. For example, we might model reaction time as coming from a distribution that is distinct for each user; and the distribution of user distributions might be governed by common population model. This is a flexible way of gradually introducing more sophisticated models.
- Frequentist methods can often be computed in a closed-form directly, exactly and efficiently. This is rarer in Bayesian methods, where approximate and computationally intensive methods are used (like MCMC).
- Frequentist methods are rarely troubled by computational problems. Because Bayesian methods depend on computational approximations, it is often necessary to tweak models so that the computation works efficiently (e.g. reparameterisation to make MCMC sample well). This is a clear case of the tail wagging the dog! Approximations can also go wrong and produce dubious results. This requires vigilance in monitoring diagnostics and can involve tricky “debugging”.
- Bayesian methods give results in terms of the likelihood of different hypotheses. This is often the question we want to answer, and means we can use the statistics to work the argument we want to make, rather than having the statistics define the argument we are able to make:
- Bayesian: “The 95% credible interval for increase in reading speed from version A to version B is [1.7, 2.1]", meaning that we are 95% sure that the reading speed improvement is in that range, given our priors.
- Frequentist: “The 95% confidence interval for increase in reading speed is [1.7, 2.1]", meaning we expect that if we ran this experiment repeatedly, the interval we computed would capture the true reading speed 95% of the time (but this specific interval might not!).
- Bayesian: “Given our priors, the expected increase in tweets read per day is +2.9, and a decrease in tweets read has a probability of less than 5%", meaning exactly what it says.
- Frequentist: “We find an mean increase of 2.9 tweets/day, and [following an appropriate test] we reject the null hypothesis with p<0.05", meaning that if we ran this experiment repeatedly, and the null hypothesis was true and variation in tweets was purely random, then we would expect to see results as extreme or more extreme than this less than 5% of the time. Is this a question we are interested in knowing the answer to?
- In all cases, these statements depend on the assumptions made. In the Bayesian case, these are the models and the priors. In the frequentist case, we have no priors to worry about, but we have a restricted class of models and distributions available, and must make sure that these are appropriate for the problem. Many common frequentist models are normal linear models and are powerful if these assumptions hold but problematic if not.
Bayesian interaction: How can we visualise and interact with Bayesian models?
One notable problem with Bayesian models is that they can be hard to understand, particularly for non-experts and particularly when couched in the traditional technical language. The results of Bayesian inference can be rich — and therefore hard to summarise and superficially non-intuitive. Building Bayesian models and verifying they are doing what is expected is a task that can be error-prone. These problem that human-computer interaction is well placed to solve.
Bayesian interaction is the problem of how to display, explain, explore, construct and criticise probabilistic Bayesian models: how and where to put users in the loop in Bayesian modelling. This involves supporting users in making rational and informed decisions, like assessment of risk or of expected value, in comprehending the structure of Bayesian models and the interpretation of their parameters, and in aiding the development of new models and debugging and criticising them. User interaction with Bayesian models has a few important aspects:
- Visualisation of uncertainty Distributions are the basis of Bayesian modelling, and so the representation of distributions to users is important, particularly the visualisation of uncertainty [padilla_uncertainty_2020] [hullman_pursuit_2018-1]. People have a hard time understanding distributions and their implications, and this is exacerbated when distributions are over a high-dimensional parameter space. Visualising and summarising distributions in ways that preserve uncertainty are significant challenges in HCI. Even in simpler problems there can be user-facing uncertainty that should not be elided. Interacting with noisy sensors, like a brain-computer interface, results in uncertain interface state. Reflecting this uncertainty to users could improve interaction, but requires new interface techniques, such as uncertain cursors.
- Interactive exploration of Bayesian models Early work in Bayesian visualisation has focused on static summaries of posteriors. There are many open research questions in user interfaces that support dynamic interaction. Interactive systems to explore possible configurations is the most promising way to communicate large Bayesian models. The ability to slice, brush or tour posterior distributions can reveal structured correlations in the results of inference [taka_increasing_2020].
- Prior elicitation and Bayesian workflow support Bayesian models depend upon suitable priors. There are open research questions around the best interfaces to elicit priors from experts, and to test and verify their validity (e.g. via interactive prior predictive checks). This ties into the problem of Bayesian workflow research: how to support users in building, running and verifying Bayesian models, such as visualisation in Bayesian workflows [gabry_visualization_2019], interactive prior elicitation [jones_prior_2014]. This might range from debugging tools to diagnose poor parameterisations or misbehaving MCMC samplers, or in defining wider processes to construct and revise models within a scientific team.
A higher perspective: How can Bayesian ideas help us understand human cognition?
There is a school of thought that interprets the thought processes of humans and other living beings as an approximate form of Bayesian inference. This “Bayesian brain” hypothesis [friston_history_2012] [friston_free-energy_2010] implies that we are all engaged in some form of approximate Bayesian inference, from low-level sensory perception through to higher-level cognition. It posits a model of cognition where organisms form predictive models of the world [griffiths_optimal_2006], and revise them in light of sensory evidence in a manner compatible with Bayesian belief updates. This framework gives a structure by which causal origins of perceptual stimuli can be inferred by organisms, and links to information-theoretic models of behaviour and perception [jensen_information_2013].
This is a controversial hypothesis, and one that is hard to gather definitive evidence for or against. However, it can be a powerful lens through which to examine how we will react and behave with interactive systems. Regardless of its biological “truth”, Bayesian cognitive models are amenable to computation and can provoke new thoughts on how to engineer interactions. As a concrete example, Rao [rao_dynamic_1997] models visual cue integration as a Kalman filter, a recursive Bayesian update process. This form of model postulates that living beings combine predictive models of how the world is expected to evolve and evaluate this against evidence from sensory channels. In human-computer interaction, research on understanding how users interpret data visualisations [kim_bayesian_2019], [wu_towards_2017] can be modelled by representing users with a Bayesian cognition and the consequent belief updates they would perform under this model.
Bayesian pasts and futures
How did these ideas come about?
Bayesian ideas of probability were first stated in a limited form by Thomas Bayes, in the 18th century, in notes that were unpublished until after his death [bayes_lii_1763]. The ideas were extended by Pierre Simon Laplace in France in the early 19th century [laplace_theorie_1812].
Bayesian interpretations fell out of favour, and for many decades these approaches were either ignored because they could not practically be used for lack of computational power, or on philosophical grounds. Vigorous and bitter debates about validity of Bayesian ideas in the first half of the 20th century left Bayesian modelling as a niche subject until the end of the 20th century. We leave the details to others; McGrayne [mcgrayne_theory_2011] is an accessible history of this conflict.
Why is this suddenly relevant now?
From the 1980s onwards, computational power became available that made Bayesian statistics suddenly practical. The development of tools like BUGS in the early 1990s, and the subsequent development of efficient Markov chain Mote Carlo samplers interfaced to probabilistic programming languages, brought these modelling tools to specialists who did not have to implement the micro-details of numerical inference. These two factors make large Bayesian models tractable, and reduce the need for clever algebraic manipulations. An increasing number of accessible texts on Bayesian modelling has ignited interest among new audiences.
There is also an increasing realisation that traditional statistical methods are not always well suited to the problems that are encountered in interaction design, and alternative methodologies can be more insightful. Some Bayesian methods, like Kalman filtering, have long been known in HCI, but as a kind of “magical” special-case algorithm, rather than what is a fairly ordinary use of Bayesian modelling.
Does uncertainty = Bayesian?
Our primary motivation for applying Bayesian modelling is to properly account for uncertainty. Uncertainty in Bayesian models is represented with probability. Probability is not the only way to represent uncertainty, but it arguably the right way to represent it [lindley_probability_1987]. Probability has a simple, rigorous axiomatic basis [cox_probability_1946]. It can further be shown that any non-probabilistic representation in a situation with uncertain outcomes of different values, as in a betting game, is inferior to a probabilistic representation, in terms of expected return [de_finetti_theory_1975]. However, there are other models of uncertainty which may be computationally or philosophically more convenient to apply; a review of alternatives is given by Zio and Pedroni [zio_literature_2013].
We can also use probability without applying Bayesian ideas, as in frequentist models. Frequentism strictly limits the elements about which we may be uncertain, limiting probability to represent the uncertain outcomes of repeatable experiments (or draws from some distribution). At the same time, this avoids the troubles of subjective probability and the well developed mathematical theory for frequentist models means that many quantities of interest can be computed quickly and without resort to approximation. Many useful probabilistic models in human-computer interaction, such as hidden Markov models for sequence recognition, are often implemented from a frequentist perspective.
Ethics of Bayesian interaction
Modelling choices are not ethically neutral, even at this highest of abstraction levels. Placed as we are at the junction between computer science and the human world, interaction designers and HCI researchers have a particular role in evaluating the ethical implications of our modelling choices and advancing ethical research practices.
- Uncertainty: above all else, failure to represent uncertainty can be an ethical failing. Bayesian methods are not the only way to work with and represent with uncertainty, but they put uncertainty at the heart of all computation. Discarding or eliding uncertainty can be deception (for example in reporting of empirical work), or can present direct risks of harm (for example, in safety critical systems). Uncertainty must be accounted for, preserved and represented. Bayesian methods are the most straightforward way to do so; some would argue the only correct way to do so.
- Priors: Bayesian methods need priors. On one hand, the requirement that assumptions are always laid out in the open as fully defined priors invites inspection and transparency. This is important if the outcome of inference affects people's lives; these explicit priors can be reviewed, challenged or modified. On the other hand, malevolent manipulation of priors can be used to produce any result at all. This implies a duty and responsibility to document and justify priors, and to publish models that allow inference to be conducted under alternative priors. Reproducibility is important for all science, but especially for Bayesian models.
- Small data Bayesian models can often make useful inferences with very small datasets, by using informative priors. This is typical, for example, is astronomical tasks like identifying exoplanets — there is simply very little data to work with. In interaction, human responses are valuable. It costs money and time to run experiments with users. Wasteful experimental designs or analyses are unethical. Bayesian methods have two advantages: they can work well in the small data domain; and active learning approaches can be used to adapt experiments online to precisely control the uncertainty remaining.
Disadvantages, cons and caveats
Why isn't everything Bayesian? We've seen how much Bayesian approaches offer, and yet it is currently has a tiny foothold in human-computer interaction. Even in other disciplines like astronomy, where it is better established, it is still a minority approach. Part of the reason Bayesian approaches in interaction can appear so appealing is because of the vacuum of general ideas in interaction ([kostakos_big_2015]) and the in-rush of enlightenment that these approaches bring lays bare much low hanging fruit.
A great deal of the slow uptake is historical, stemming from the rancorous debates over the validity of Bayesian ideas in statistics and the absence of workable solutions to perform inference. However, there are real issues with Bayesian approaches that need to be understood.
- Computational resources Bayesian methods can require extensive computational resources, certainly compared with common frequentist experimental analyses. In real-time settings with a human-in-the-loop, Bayesian inference may be difficult to compute quickly enough to maintain responsiveness. In large, complex offline analyses with hundreds of parameters, inference can be extremely time consuming. In cases where uncertainty is not especially relevant, or good priors are not available, other approaches may be much more practical. Non-Bayesian machine learning or statistical approaches will likely outperform Bayesian methods in such cases.
- Approximations Computational approaches to Bayesian inference almost invariably rely on approximations. Approximations can be hard to configure. They can go wrong and produce meaningless results. They can be hard to debug. Diagnostics are available, but are not perfect indicators of flaws. Care must be taken in formulating problems to get a form that is both conceptually correct and practical to approximate. Users of Bayesian methods need to be diligent in verifying the quality of approximations, and reporting carefully exactly how inference was performed and any relevant diagnostic measures.
- Communication and understanding Bayesian methods may be harder to communicate to audiences unfamiliar with them. This presents a barrier to dissemination. There are venues where reviewers expect to see an ANOVA and a p-value and will be uncomfortable if these are absent. On the other hand, Bayesian models and results are often easier to correctly interpret once understood. Credible intervals and posterior histograms coincide more closely with human intuitions than confidence intervals or other frequentist summaries. There is not always a standard way to represent the results of inference. Bespoke visualisations or summary statistics may be needed.
- Formulation of problems Bayesian approaches are extremely general. This also implies that there is a lot of work in correctly specifying a Bayesian approach. The real difficulty is in formulating problems in terms of probabilistic models. This is a difficult skill to acquire and takes a change in perspective that is unfamiliar to most researchers and practitioners. Bayesian models can be much more sophisticated than standard statistical methods. This offers power, but it can often be hard to explain something like a hierarchical Bayesian model, and particularly to give meaningful names and interpretations to high-level parameters (“the mean of the variance of the distribution of variances over variances”). Bayesian models will be specific to the problem under consideration, and not an “off-the-shelf” statistical model like a t-test or ANOVA. This means that these models have to be communicated clearly and rigorously.
- Subjectivity Bayesian methods are typically applied in a subjective fashion (there is such a thing as objective Bayesian statistics, but this is perhaps best left alone). It only answers questions that relate to how belief changes from a prior in the light of evidence. Most of the time, this is what we want, and subjectivity is a desirable quality. Subjective beliefs, however, require justification and explanation. Documenting how results are arrived requires care and thought.
Where do I go from here?
Introductory texts on Bayesian statistics
- For those looking for a first introduction to Bayesian statistics, we particularly recommend McElreath's Statistical Rethinking [mcelreath_statistical_2018], which provides a thorough and highly readable grounding in Bayesian modelling without assuming any background.
- Think Bayes (second edition) [downey_think_2021] by Allen Downey is a slender and accessible text on Bayesian statistics with extensive worked examples in Python.
- We also recommend Lambert's A Student's Guide to Bayesian Statistics [lambert_students_2018], which has excellent supporting video material.
- McGrayne's The Theory that Would not Die [mcgrayne_theory_2011] is a very accessible popular science account of the history of Bayesian reasoning and is enlightening in establishing the context in which Bayesian methods are discussed and used in the statistical world.
- For a more mathematically rigorous discussion, the series of online articles by Michael Betancourt are self-contained, rigorous and beautifully illustrated. In particular, Foundations of Probability Theory [betancourt_probability_2018], Conditional Probability Theory for Scientists and Engineers [betancourt_conditional_2018], Probabilistic Computation [betancourt_probabilistic_2019-1], Modeling and Inference [betancourt_probabilistic_2019] and Towards a Principled Bayesian Workflow [betancourt_towards_2020] are approachable for computer scientists with some background in mathematics.
More advanced texts
- Bayesian Data Analysis by Gelman et al. [gelman_bayesian_2013] is the standard book on Bayesian approaches to data analysis. It requires significantly more mathematic background than the introductory texts listed above, but is a comprehensive resource.
- Regression and other Stories by Gelman, Hill and Vehtari [gelman_regression_2020] is thorough introduction to Bayesian regression modelling, and encompasses both the how and the why of regression modelling.
- A more adventurous text that links together information theory, machine learning and Bayesian approaches is Information Theory, Infernece and Learning Algorithms [mackay_information_2003-1] by MacKay (who, in the HCI world, introduced the Dasher probabilistic text entry system [ward_dasherdata_2000]). This is a more mathematically challenging text, but the perspective that it provides is one that is particularly useful for human-computer interaction, where flows of information interact with inference engines.
Bibliography
[friston_history_2012] Friston, Karl. 2012. “The History of the Future of the Bayesian Brain.” Neuroimage 62-248 (2): 1230–33. https://doi.org/10.1016/j.neuroimage.2011.10.004.
